For sportstats
home page, and info in Test Cricket in Australia 1877-2002, click here
Who are the Fastest-Scoring
(and Most Tenacious) Batsmen in Test Cricket? Click Here.
NEW! The Fastest, and
Slowest, batsmen in Ashes Tests.
Longer articles by Charles Davis
|
28 Feb 2007 Complete
crowd figures are now available for the Australian season of Tests and ODIs.
With 813,000 watching the Tests, and 426,000 watching the ODIs, the total attendance
of 1,239,000 is an all-time record, and only the second time the total has
exceeded one million, the first being in 1982/83. The Test
figures surpassed the surge in interest of the mid-1970s, which peaked at
777,000 in six Tests in 1974/75. (This interest was demolished by Kerry
Packer). However, this season’s Tests total is not a record, falling short of
the Bradmania-fuelled seasons of 1946/47
(847,000) and 1936/37 (949,000). In terms of intensity of public interest (in
a much smaller population), that era will remain Australian cricket’s
highpoint, but the current season has surpassed them in terms of daily
average crowds. Tests were longer back then, so the 1936/37 record was spread
over 26 days, vs 22 for the current season. This season’s daily average of
37,000 just edges out the 36,500 for 1936/37, and is a new all-time high. This in
spite of the fact that Melbourne lost two days of potentially lucrative
cricket. In fact, Cricket Australia lost more money through the loss of just
the fourth day of the Melbourne Test than it made in the whole Perth Test. Comparing
totals over four-year Ashes cycles, the last four years has been the
best-attended in Australian cricket history, with 2.33 million coming to the
Tests, surpassing the 2.21 million from 1973/74 to 1976/77, although the
daily averages over the four years were higher in the 1970s. The
picture with ODIs is less encouraging. In spite of the Ashes surge of
interest, this season’s crowds only ranks 12th since 1980. This was in spite
of a flying start with 78,000 at the MCG, and a surprising finale that
attracted fair crowds. The series sagged in the middle in a serious way, and
authorities must surely be looking at a major revamp. For the first time
since ODIs took hold in 1979/80, average daily crowds for ODIs (30,400) were
lower than for Tests (37,000). Longer-term
trends are very much in Tests favour. Total ODI crowds were more than 50%
higher than Tests for much of the 1980s. Tests made a gradual comeback in the
1990s, catching up by the turn of the century, and now the positions are
reversed, with Tests soaring more than 50% above ODI crowds in the last five
years. The
underlying trend for Tests has been relentlessly upward since 1990, while
ODIs have been falling since 1999. One suggestion
for ODIs: SHUT OFF THAT BLOODY MUSIC. I listen to a lot of music of most
kinds, but I listen to what I want when I want, and I don’t want it foisted
on me where there is no avoiding it. What may work for two-hours at the
basketball or ice hockey does not work for seven hours at the cricket. |
||||||||||||||||||||||||||||
|
13 Feb 2007 A curious
little set of figures about Mike Hussey and Stuart Clark, two stellar
performers since they were promoted to international cricket. Their background
in Australian domestic cricket, while quite good, bears no resemblance to
their international stats. Stuart
Clark, in Australian domestic first-class cricket, averaged 30.51 (since
1997) with the ball before his promotion. In the three years before his first
Test, he did a little better, averaging 28.07. Decent figures, but who could
have predicted a start where he took 47 wickets at 17.8 in his first nine
Tests? Mike
Hussey figures seem similarly disconnected. His domestic fc
average in Australia was 42.7 before he became a Test player. In the three
years before his promotion, it was a little higher, at 44.4. Since then, he
has enjoyed the best Test career start since Bradman, and averages 79.85
after 16 Tests. In a
curious parallel, Hussey’s average in domestic one-dayers was 42.6, rising to
44.4 in the last three years before promotion. These figures are almost
identical to his first-class figures. The start to his ODI career was
unprecedented. He has lost form just lately, but only two weeks ago his ODI
average was almost identical to his Test average, at 79.9. It’s a
testament, I suppose, to the selectors’ ability to spot genuine talent, even
when it is not reaching its potential. But spare a thought for Michael Bevan,
who averaged close to 70 in Australian fc cricket
over the period that Hussey’s star has risen. |
||||||||||||||||||||||||||||
|
7 February 2007 The
fastest and slowest scorers section has been updated. The appearance of Mike
Hussey at #4 on the “Most Tenacious” list is quite notable. |
||||||||||||||||||||||||||||
|
27 January 2007 Sorry
for lack of posts. No excuses. But I
have reached a little milestone. The re-scoring of an original scorebook of
the Adelaide Test of 1954/55 has been completed, allowing Balls Faced for batsmen
to be calculated for the first time. This completes the set of Ashes Tests
from 1928 to the present: Balls Faced is complete for all matches. The most
recent Ashes Test for which BF data is not available is the Oval Test of
1926. This one is unlikely to turn up any time soon. Nottingham 1926 is also
missing, but this Test was almost completely washed out, with 32 runs in 46
minutes play. Data is complete for all other Ashes Tests post-WWI, and also
for 1905, 1909, 1911/12, and important bits of 1912 (Triangular). Data is
quite patchy before 1905. One day I
hope to publish this, somehow. How to make money out of this is the problem,
since big websites copy the hard-won data and display it for free. They are
entitled to do this, strictly speaking, since you can’t copyright stats, but
it discourages original research. A Quick Murali/Warne Comparison It’s a
perennial argument, which will go on long after Shane Warne’s retirement.
We’ll never establish who is the greater bowler, but we can look at evidence.
One
problem comparing the career stats of the two bowlers is the vast difference
in the mix of locales and opponents that make up their stats. It occurred to
me that a comparison on purely neutral territory might be interesting. This
excludes all Tests in Australia and Sri Lanka, and for good measure I have
excluded, for obvious reasons, Tests against Bangladesh and Zimbabwe, which
favour Murali, who has taken 137 wickets against these opponents. Murali
still comes out ahead: SK Warne:
62 matches, 318 wickets, 25.4 avge, 5.13
wickets/match. M
Muralitharan: 37 matches, 218 wickets, 23.7 avge,
5.89 wickets/match. It is
striking that Murali has played only 37 of his 110 Tests in this category.
However he still beats Warne on both average and wickets per match, which are
the two most critical stats for bowlers. In the latter stat, Murali
undoubtedly benefits from the lack of other top bowlers in his team. However,
I would expect this lack to also damage his bowling average. Sri Lanka bowls
out its opponents less reliably than does Australia; This means Australian
bowlers have more chance to bowl at tailenders,
which helps their stats. Warne has just about the highest proportion of
tailend wickets of any major bowler, partly for this reason. Things do
get closer if Tests in the West Indies are excluded, since Warne performed
poorly there (He was even dropped from the team in the West Indies on one
occasion). Murali still has the edge, though. 7 January 2007 Some
Tests are remarkable for their individual performances. The Sydney Test was
instead remarkable for their absence. Only once before has an Ashes Test been
completed with neither a century by any batsmen nor four wickets in an
innings by any bowler. That was in 1970/71, coincidentally in the last Test
of a series, at the SCG. Only two other Tests are in this category – Zimbabwe
vs India in 2001, and South Africa v Sri Lanka in 2002 – plus the
controversial contrived Test in South Africa in 2000, where two innings were
forfeited. The
Sydney result was a microcosm of the series. In the match, Australia averaged
twice as many runs per wicket as England, 43.90 to 21.90, 2.005 times to be
exact. For the series as a whole, the ratio of team batting averages was
2.003. This ratio
of team averages is perhaps the best simple measure of the difference between
teams. The result of 2.003 for the 2005/06 series is the greatest performance
gap for any Ashes series in Australia, and is far greater than the ratio of
1.63 for the 1920/21 whitewash. However, it has been exceeded twice in
England: 2.088 in 1989, and 2.35 in England’s favour in a three-Test series
in 1886, when the highest innings of the series for an Australian batsman was
32. By being
bowled out for 393 in Sydney, Australia just missed repeating the feat of the
1989 team (in England) who reached 400 in every Test of an Ashes series. In
home Tests, Australia scored over 400 in all five Test against Pakistan in
1983/84. Perhaps
the oddest thing about England’s first innings of 291 was that the first six
batsmen all reached 20, yet the team was bowled out short of 300. This has
never happened to England before, and only one other team, New Zealand, has
done it. The Kiwis have actually managed it three times; the worst being 245
all out against South Africa in 1954, when their top six all reached 20, but
no one reached 50. England’s
last five batsmen had contributed only four runs to the total. This is not
exactly unprecedented in Ashes Tests, especially in recent times when
England’s tail has habitually failed. (At the MCG in 1990/91, England’s last
five batsmen scored just two runs in the second innings.) However, such a
failure has not been seen in a team total of over 250 before. Shane
Warne scored more runs in the series than Harmison, Panesar,
Anderson, Hoggard, and Mahmood combined. Shane
scored 196 in five innings, and the English tail 168 in 33 innings. Shane
Warne’s last Test may have been unremarkable with the ball, but in his 145th
match, he did manage a personal batting first: it was the first time that he
had made the highest individual innings (71) for Australia in a completed
Test. He had previously top scored for Australia in a drawn Test, when he
scored 99 against New Zealand in Perth in 2002. Justin
Langer finished his career with an average of 48.7 in home Tests, or 49.5 if
you ignore the World XI so-called “Test”. In England, Justin’s Test average
is 55.1. Among Australians, only Don Bradman and Sid Barnes achieved better
averages in both countries. Glenn
McGrath took a wicket with his last ball in Test cricket, just as Dennis
Lillee did in his last Test in 1984. Australia’s
scoring rate for the Ashes series was an outstanding 65.1 runs per 100 balls.
This was short of the 68.2 r/100 balls for Australia in the 2002/03 series,
but otherwise it has not been exceeded in a five-Test series in Australia,
except in 1910/11 vs South Africa, when Trumper, Hill and co. scored at 69.7
r/100 balls. Australia’s best scoring rate ever was 71.3 r/100 balls in
England in 2001. |
||||||||||||||||||||||||||||
|
5 January 2007 The New Invincibles With
McGrath and Warne, Australia has forgotten how to lose. Over the
past decade, Australia has occasionally looked beatable in the absence of either
Glenn McGrath or Shane Warne. This is not a novel observation. Even so,
looking at exact figures, it is astonishing to discover just how rarely
Australia is beaten when both champions are available. Together, Warne and
McGrath last tasted defeat in the March 2002 Test in Durban; since then the
two great bowlers have shared a run of 35 unbeaten Tests. This extends to 47
Tests since their last loss in a “live” rubber, at Madras in 2001. The
figures for home Tests are just as remarkable. The last time Warne and
McGrath played in the same losing side in Australia was in 1996/97 (a
10-wicket loss to the West Indies in Perth). Since then, Australia at home
has been invincible with both bowlers on deck, winning 32 Tests, drawing six,
losing none. It’s not
as though the firm of McGrath and Warne has not known defeat. There was the
2-1 loss in India in 2001, and a 2-2 draw in the West Indies in 1999. But as
Australia’s batting strength has grown ever deeper in recent years, the
losses have become rarer than ever. The overall figures showing Australia’s
win/loss performance in the last five years is:
England has
never won a Test in Australia in which both Shane Warne and Glenn McGrath
played. The
batting averages of Australia’s opponents show that the absence of either
bowler has had an impact on Australia’s fortunes, and the effect is amplified
when both are absent. Over the last 10 years, opponents’ averages have been: With both
players present (84 Tests): 25.9 runs per wicket. With
Warne absent (29 Tests): 29.0 With
McGrath absent (25 Tests): 34.1 With both
players absent (9 Tests): 39.0 The average
with both absent rises to 42.7 if Tests against Zimbabwe are ignored. Such an
average, although based on a small number of matches, is a cause for concern.
It is similar to the average of West Indian bowlers in recent years; the West
Indies have been managing only about one Test victory per year against
serious opposition over the last five years. McGrath
and Warne will be missed; just how much remains to be seen. One good sign,
for the team, is that neither bowler has been Australia’s best in the whitewash,
that honour going to Stuart Clark. Australia’s batting will remain strong, so
the worst case is probably that Australia will decline from
near-invincibility to mere dominance. The
absence of any real challengers to Australia’s #1 position creates an
environment different to the last mass retirement, that of Greg Chappell, Rod
March, and Dennis Lillee in 1984. Lillee, in particular, was every bit as
critical to his team’s success as Warne or McGrath, perhaps even more so. His
career was marked by 31 wins to 16 losses; when he was absent, Australia’s
fortunes were almost reversed, 14 wins and 21 losses, and the ratio is even
more extreme if Tests just before and just after his career are included (15
wins, 32 losses). The
“Lillee effect”, however, was much stronger at home than away, because he
played very few Tests on the subcontinent or in the Caribbean. By contrast,
both Warne and McGrath have stronger records away than at home, so we might
expect Australia to miss them more when on tour. When Lillee
and the others left the stage, the West Indies immediately took up the mantle
of top team, thanks in part to a nightmare schedule where the new Australia
played ten Tests in twelve months against them, a sequence that destroyed Kim
Hughes’ career. The current Australians team, even without its retirees, has
much less to fear. |
||||||||||||||||||||||||||||
|
|
31 December 2006 Although
massive winning margins are not rare in Ashes Tests, especially in recent
times, England’s performance at the MCG was, arguably, an all-time low. Only
twice has England ever been beaten by a greater margin inside three days – in
1894/95 at Sydney by an innings and 147 runs, and by New Zealand at
Christchurch in 1983/84, by an innings and 132. On both occasions, England
was caught on a bad wicket and had to follow-on; no such mitigation is on
offer for the Melbourne Test. It was England’s worst defeat in Australia for
more than 50 years, when they went down by an innings and 154 at Brisbane in
1954/55 (in five days). However, on that occasion they bounced back and won
the series. Just how
impotent was the England batting? Well, they lost 20 wickets but hit only 17
boundaries in the match. Registering fewer boundaries than wickets is rare.
Flintoff’s men share this distinction with the very first England team at the
MCG in 1877, but it has happened only three times in the last 100 years in
Ashes Tests: Australia at the Oval in 1912, England on the same ground in
1948, and England at the MCG in 1978/79. Boundaries
were especially infrequent on the third day, with only twelve hit in 78
overs. Curiously, there were also twelve hits for three: normally there are
at least three times as many fours as threes. Sponsors who paid for
advertising to be flashed on the big screens with every boundary possibly feel
short-changed. Andrew
Symonds reached his first Test century with a six. A few Australians have
done this before – John Benaud, Ian Davis, and Greg Matthews – but Symonds
is, technically, the first in an Ashes Test. In 1893, Stanley Jackson (England)
hit a ball over the fence to reach his first Test century, but in those days
such shots only counted as four runs. The MCG
may have missed out on the single-day crowd record for Test matches (90,800
in 1960/61), but, thanks to the early finish, the daily average of over
81,000 is probably a record for all Tests. The MCG’s previous best average
was 60,000 in 1954/55, and even in the record-setting Test of 1936/37
(350,000 over six days), the average on the first three days was 77,000. The
only other ground that could challenge this is Eden Gardens in Kolkata, where
numbers are usually just estimated; it recorded daily averages around 79,000
in 2000/01 and in 1981/82. It seems
incredible now, but it was only last year that Australia produced just one
individual century in the first four Tests of an Ashes series. One
rarity from the Melbourne Test: Australia was bowled out for just 419 after
two batsmen scored 150s. It is the lowest completed innings to include two
150s for any Test involving Australia, although as a record it has been
beaten narrowly in two other Tests: West Indies 414 all out vs England at
Georgetown 1968, and Pakistan 417 vs West Indies at Karachi in 1997. The
279-run partnership by Matthew Hayden and Andrew Symonds produced no less
than 37.7% of the match runs, and over 48% of the boundaries. This is the
highest contribution by a single sixth-wicket partnership to a completed
Test. The record percentage, for any wicket, was set by the recent 624-run
3rd-wicket stand of Sangakkara and Jayawardene against South Africa, with
48.8% of the match runs. Surprisingly,
Hayden’s 153 marked the first time he has reached 150 in a Test since his
record 380 against Zimbabwe in 2003, even though he has scored twelve
centuries in that time. UPDATE: Sreeram points out that the 1998/99 Test at Eden Gardens
attracted about 465,000 people, averaging over 90,000 per day. These numbers
are only estimates, but chances are this was the best-attended Test ever. |
|||||||||||||||||||||||||||
|
27 December 2006 With
Shane Warne dominating the sporting pages once again, there has been no lack
of statistical analysis thrown about. But perhaps one aspect of Warne’s Test
career, its start, could do with a little more. Strange to report (for this
column), but Warne’s early career was a triumph of selectorial judgement over statistics. Consider
Warne’s pre-Test career, or the lack of it. Warne played only seven
first-class matches before his Test debut. For Victoria, he had just eight
wickets to his credit. Few bowlers have been selected for Australia on so
little information. Here is a list of those with fewest wickets in Australian
first-class cricket on Test debut, (since 1900): JR
Watkins (1973): 5 matches, 10 wickets. MR
Whitney (1981): 4 matches, 11 wickets. WJ Whitty (1909): 6 matches, 14 wickets. SK Warne
(1992): 5 matches, 15 wickets. JR
Thomson(1972): 6 matches, 18 wickets. John
Watkins was one of the greatest selectorial disasters ever: not only was his
Test bowling (against Pakistan) an embarrassment, but he never played
first-class cricket in Australia again. (However, he did add 84 in a
match-turning 9th-wicket stand with Bob Massie, who was also playing his last
Test). Mike Whitney was a special case: he happened to be playing in England
when the 1981 touring team was struck by injury, and as with Bill Whitty in 1909, he had form in England to go on. Warne’s
early promise, while recognised by many, was entirely of the non-statistical
kind. After taking 1 for 150 on debut, his average climbed to a disastrous
346 just before his second wicket. This is the worst Test average ever
endured, however briefly, by any Australian bowler. Next on the list is
part-timer Ian Chappell, whose average once stood at 267. Only a handful of
bowlers have known worse averages, led by Khaled
Mahmud (Bangladesh) 480, FR Martin (West Indies), 480 (approx.) and RF Surti (India), 458. Less well
known is the fact that Warne, after taking 3 for 11 against Sri Lanka,
continued to struggle. He went wicketless for the rest of the series, and was
not selected for the first Test of the West Indies tour of 1992/93. For the
second Test at Melbourne, injuries brought him back into the team, and after
a single tailend wicket in the first innings, he finally turned it around
with a second-innings 7 for 52. In the meantime his average had risen above
100 once again, reaching 112.75. One
wonders if such selectorial indulgence would be repeated in this era of total
Australian dominance. In any case, Warne’s subsequent career is a testament
to self-belief. That 7
for 52 remains his best innings return at Melbourne, revealing another oddity
of Warne’s career. Success on his home ground has been surprisingly limited,
even though his total of 49 wickets at the MCG, so far, is second only to
Dennis Lillee’s 82. In senior cricket of all kinds, barely ten per cent of
Warne’s 1,700-plus wickets have been taken on the MCG. Warne has never taken
ten wickets in a first-class match on the MCG, and his name will not be found
on a list of the 100 best bowling performances at the ground. Warne has a
weaker record in Tests at the MCG than in Sydney, Brisbane or Adelaide, or in
Bangladesh, England, New Zealand, Pakistan, Sri Lanka, Zimbabwe and South
Africa. Perhaps
this underlines Warne’s greatness even more, in that he has fashioned such a
career in spite of being unsuited to his home ground. In this respect, at
least, he is very different to his great rival, Muralitharan, who performs so
much better home than away. ******** And
here’s a little article I wrote recently on the very first Test match: It wasn’t
called a Test, it started out as a “Combination Match”. For some years, the
status of the first Test of 1877 was uncertain. Australian reports
accorded it great importance, while Wisden completely ignored it. But
there is little doubt, now, of the historical significance of that match at
the MCG. The MCG
was still true to its name in 1877. Football was rarely played there, and the
fine new grandstand on the northern side was built specially for the tour of
Albert Shaw’s English professionals. A
contemporary photo shows a patchy surface. The fence was partly white pickets
and partly chain-link, and there was a path inside the fence. The many trees
around the ground were popular with fitter spectators disinclined to pay
admission. The pitch in those days ran roughly east to west, along the long
axis of the ground, where the football goal posts are set today; there were
no sightscreens, which may account for the early finishing time of 5:00 pm. The match
had been arranged at short notice late in the season. The Englishmen returned
from an eventful tour of New Zealand, tired and seasick after a difficult
voyage, and one player short; wicketkeeper Pooley
had been arrested in New Zealand after a betting scandal. Another player,
Armitage, had been injured in a stagecoach accident. The New
South Wales players arrived by steamer – there were no interstate trains.
Champion bowler Fred Spofforth was invited by the
sole “selector”, promoter John Conway, but stayed home because his favourite
wicketkeeper, Murdoch, was not selected. Interstate politics, intense in
those pre-Federation days, played a part. The final “combined” Australian
team contained six foreign-born players, and, like “England”, was not fully
representative. Play was
delayed to 1:00 pm (on a Thursday), perhaps to accommodate the tired
tourists, who were nevertheless criticised for
indulging in “hasty and valueless practice”. There was a lunch break at 2:00
pm, but no tea break. About
1,500 spectators watched Shaw bowl the first ball, round-arm, from the
eastern end, to Charles Bannerman. The crowd later reached 4,500, not
including thousands who watched from outside, many perched in the trees. What sort
of cricket would they have seen? Four-ball overs, with bowlers sometimes
changing ends by bowling consecutive overs. Overarm
bowling was new-fangled then. One bowler, George Ulyett, achieved surprising
bounce. B.B. Cooper batted without gloves until struck painfully, and Ulyett
eventually ended Bannerman’s innings with a blow on the hand (Bannermans’s gloves being in poor condition). Bannerman
had batted with a sustained confidence rarely seen in those days. His
technique was probably limited, and he strongly favoured
the drive; however, he did make some fine strokes square of the wicket.
Fields were set for the drive right from the first over. His strokeplay adapted to circumstances. When wickets fell
just before lunch, Bannerman remained scoreless for 14 overs, and he faced
about 150 balls before reaching 50. Then he hit eight boundaries in half an
hour, racing from 50 to 100 off about 40 balls, reaching 100 in the 93rd
over. When Midwinter was caught attempting the first “six” in Test cricket,
Bannerman returned to the defensive, finishing the day with more than three-quarters of Australia’s runs, 126* in
195 minutes off about 235 balls. England bowled 140 balls per hour, more than
50% faster than the modern standard. His final
score of 165 retired hurt off about 330 balls remains a record for an
Australian on Test debut, and by scoring over 67% of Australia’s runs, (9.17
times more than the next best), Bannerman set records for innings domination
that still stand. Curiously, the oldest Test record is not held by Bannerman.
That honour goes to James Southerton, still the oldest player on Test debut,
aged 49 years, 119 days. |
||||||||||||||||||||||||||||
|
18 December 2006 So
England held the Ashes for only 462 days. It’s the shortest tenure with the tiny
urn since the ladies of Rupertswood crafted it and burnt those bails in jest
in 1882. The concept of the Ashes did not really take hold until the first
official MCC tour in 1903/04, when ‘Plum’ Warner, the England captain,
promised to win them back. He was successful, but since then Australia has
held the Ashes for something like 23,500 days, to England’s 14,100 (or
thereabouts). Holding onto the Ashes for only three Tests is also virtually
unprecedented, although Australia, technically, held the Ashes for just three
Tests in 1892-93. (At that time, the Ashes was not widely recognised as an
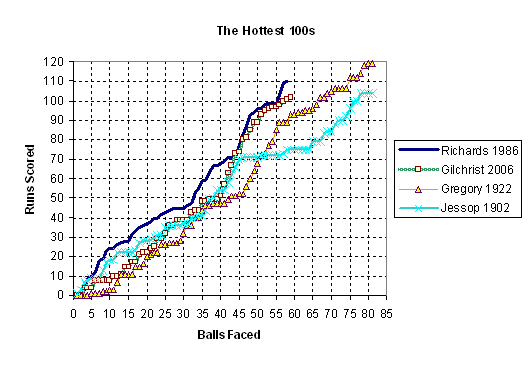
institution.) ******** Adam
Gilchrist’s century off 57 balls at the WACA is even more noteworthy
considering that Viv Richards’ 56-ball all-Test record was set at St. John’s,
a ground that in only 21 Tests has been the scene of a number of batting
records, including scores of 400* and 375 by Brian Lara. Batsmen flourish
there thanks to very short boundaries, fast outfields, and a distinct down
slope from wicket to boundary. ******** Records
broken by Gilchrist include fastest Test century in Australia (previously 71
balls by Roy Fredericks at Perth in 1975), fastest by an Australian (67 balls
by Jack Gregory at Johannesburg 1921) and fastest in Ashes Tests (76 balls by
Gilbert Jessop at the Oval in 1902). [The attached graph
shows ball-by-ball comparisons of some record-setting centuries. Note how
both Richards and Gilchrist paused, relatively speaking, in the 40s and 90s,
but went ballistic in between.] ******** Gilchrist
may have just missed out on the fastest century of all, but his progress from
50 to 100 off just 17 balls is an all-Test record. Data for this record is
hard to come by, but the following would be a reasonably complete list: Fewest balls
faced from 50 to 100 in Tests.
17 Adam Gilchrist (Aus vs Eng), Perth 2006. 20
(approx.), John Sinclair (SAf vs Aus), Johannesburg, 1902. 21 Brian Lara (WI vs Aus), St. John’s, 1999. 23 Viv Richards (WI vs Eng), St. John’s, 1986. 23 Shahid Afridi, (Pak vs Ind),
Lahore 2006. 24 Jack Gregory, (Aus v SAf), Johannesburg
1922. The
figure for Sinclair in 1902 is not precise, but it is almost certainly
greater than 17. He did, however, score 34 in two consecutive overs, still a
Test record. Gilchrist’s later batting almost has a precedent. In 2001, Craig
McMillan rocketed from 50 to 98 off 16 balls against Pakistan. He was caught
on the boundary next ball from a shot that was heading for a six. ******** The
Australians were entitled to be surprised by their first taste of Monty Panesar’s off-spin. Not only was Panesar’s
first innings return of 5 for 92 achieved on that spinner’s graveyard, the
WACA, but it is the best return for any visiting spin bowler on Australian
debut. The previous best was 5 for 99 by left-armer
Alf Valentine of the West Indies at the ’Gabba in 1951/52. If England had
noted the success of Mohammad Rafique of Bangladesh
against Australia in April (9 for 160 at Fatullah) they might have used Panesar earlier. ******** The
Australian batsmen have now topped 500 in four consecutive Tests, going back
to the second Test in Bangladesh in April. This is only the second time Australia
has done this, the other being the first four Tests of 1968/69 vs the West
Indies. Before the current streak, Australia reached 500 only once in its
previous 17 Tests. There are a number of factors behind the change, chief
among them the incredible consistency of Mike Hussey. ******** |
||||||||||||||||||||||||||||
|
5 December 2006 Thirty
runs before lunch? Seventy runs in two sessions? It is a long time since
scoring slower than this has been seen in Australia. Trevor Bailey, at his
slowest, helped England to eke out 66 runs before tea at Brisbane in 1958 (19
before lunch), but such scoring has been rare since. England scored 30 in a
session at Perth in 1978, as did South Africa at Adelaide in 1994. Readers
who can remember other extremes, in Tests anywhere, please get in touch. It seemed
a consensus view that if England was to win at Adelaide, it was vital to win
the toss and bat first. Strangely, this view ignored recent history. Teams
batting first at Adelaide have lost six of the last eleven Tests, winning
four, with one drawn. This is partly because Australia generally wins
regardless of when they bat, but the only team to beat Australia at Adelaide
in the last 10 years (India in 2003/04) lost the toss and batted second. The
Adelaide Test is a perfect example of why teams batting first nowadays lose
more Tests than they win, a fact little-known and little-understood. Had the
performances been identical but with Australia batting first, the result
would have been a draw, because Australia would have had to delay a second-innings
declaration. When he
declared at only six wickets down in England’s first innings, Andrew Flintoff
was probably not aware just how rare such a luxury is against Australia. In
fact, England have never before declared with so few wickets down when
batting first in an Ashes Test, except in a couple of rain-affected matches
long ago. On the
final day, Michael Clarke hit the first stroke for seven in an Ashes Test.
‘Patsy’ Hendren holds the record with a hit for eight at Melbourne in
1928/29. It is
extraordinary to see a Number 4 batsman “carry his bat” yet score only 22 not
out, as Paul Collingwood did on the fifth day. Only CEM Wilson, who made 10
not out for England against South Africa 106 years ago, has made a lower
unbeaten score from number 4 in a complete innings. The
frustration of the Australian bowlers was palpable during the record 310-run
fourth-wicket partnership of Collingwood and Pietersen, but oddly enough, it was
not a novel experience for them. In spite of an overwhelming dominance of
Test cricket, Australia has now conceded five triple-century partnerships in
the last ten years, the most conceded by any country. Zimbabwe and Bangladesh
have conceded only one each. Australia’s nemesis has been the enigmatic VVS
Laxman, involved in three 300 stands. The
Collingwood/Pietersen stand lasted 350 minutes, England’s second-longest
partnership (in minutes) in Ashes Tests. The record is held by the
Hutton/Leyland stand at The Oval in 1938, which lasted 381 minutes for 382
runs. The
Adelaide Test saw the second instance in Test history of a triple-century
partnership for a losing side. The other was only four months ago, when
Mohammad Yousuf and Younis Khan added 363 for Pakistan at Leeds, only to lose
to England by 167 runs. England’s 551 and Collingwood’s 206 are England
records for a losing side, and England are the only side in Test history to
declare first innings with four wickets to spare and lose. Matthew
Hoggard’s 7 for 109 was the best innings return for an English bowler at
Adelaide in living memory, since JC “Farmer” White took 8 for 126 in 1928/29. Common
wisdom has it that declaring just before stumps confers an advantage, because
opening batsmen so dislike having to come out just for those few overs. After
all, it feels to them like a “no-win” situation. When it happened in Adelaide
I thought it would be interesting to look at what happens to such teams, so I
conducted a mini-study, looking at 50 recent matches where teams (batting
first) batted for more than 150 overs. Did their opponents really fail if put
under pressure late in the day? After all, the important question is not how
cricketers feel about a certain situation, but how well they perform. Teams
that had to bat less than 15 overs before stumps did struggle at times,
losing one or more wickets eleven times out of 16. The average opening stand
was 31, compared to 39 for those coming in with 15-40 overs left. However,
the eventual scores for teams put in late in the day were actually better,
averaging 341, vs 329 for the teams whose innings started earlier. From the
perspective of teams batting first, an earlier change of innings (with 15-40
overs left on the second day) leads to more victories than a later one (55%
to 41%). In a separate category, teams that continue batting into the third
day rarely win, with twelve out of thirteen such Tests being drawn. |
||||||||||||||||||||||||||||
|
3 December 2006 I have
uploaded a few “statistical
snippets” that were published in The Age’s Ashes Magazine 1 December 2006 Run-scoring
at the Adelaide Oval has changed in character in the last decade. Once the friendliest
ground to batsmen in Australia with over 35 runs per wicket, it is now in the
middle of the pack, averaging around 32 in the last decade. Spin bowlers are
finding it easier to get wickets there, although spectacular returns are
still rare. The only bowlers to get ten wickets in an Adelaide Test in the
last 20 years are an odd pair, Michael Bevan and Colin Miller. ******** In
contrast to their 18-year unbeaten run in Brisbane, Australia have
occasionally lost at Adelaide. But England will, at the very least, have to
work hard for success. When India won at Adelaide in 2003/04 (Australia’s
last home defeat), they had to overcome an Australian first innings of 556,
with Ricky Ponting making 242, the highest individual innings ever made for a
losing side. Australia has passed 350 in their first innings in the last 13
Tests at Adelaide, exceeding 400 in the last seven matches. ******** It
doesn’t sound like the right place or time for Steve Harmison to attempt a
comeback, after his nightmare at the Gabba. Unfortunately, the tour is so
compressed that there is almost no time for a player to work back into form,
least of all when a fundamental technical problem emerges. The 44-day
schedule for the Test series is the shortest in Ashes history, shorter even
than the 4-Test series in 1975 that had to be fitted around the World Cup.
This sort of compression is not so unusual recently, but doesn’t the “most
anticipated series ever” deserve better? ******** Adelaide’s
reputation as the most popular Australian ground for six-hits, thanks to its
short square boundaries, has gone into complete reverse recently. While
six-hitting has increased at Adelaide, it has increased far more elsewhere,
and Adelaide has dropped from first to last on the list of major Australian
grounds. Since 1997, there have been 47 sixes at Adelaide, 56 at Perth, 61 at
Melbourne, 66 at Sydney and 71 at Brisbane. Compare that to the period
1946-1976, when the 61 sixes hit at Adelaide was well ahead of other grounds,
and more than twice the number at Melbourne, in spite of the MCG seeing far
more matches. This
suggests that the massive increase in six-hitting in recent times has been
focused on hits down the ground, or behind the wicket. Adelaide is still too
long a ground for many straight sixes, but Australia’s other grounds have
come more into range, thanks to boundary ropes and improved bats. Another
factor may be the relative improvement in spin bowlers’ figures at the
Adelaide Oval. ******** Having
played his 20th Test innings, Mike Hussey now qualifies for the official list
of Test batting averages. At 76.56, his average is, for now, second on the
all-time list, after the Great Bradman. Perhaps a more telling comparison is
with batsmen at the 20-innings stage of their careers. Hussey is also in rare
company by this measure.
Judging
by this list, the chances of Hussey sustaining his average don’t look good,
but a stellar career still beckons. Four of these batsmen remain in the
all-time Top Ten for final career batting average. Hussey is probably better
off without the “next Bradman” tag that weighed down the careers of Harvey
and O’Neill. ******** |
||||||||||||||||||||||||||||
|
27 November 2006 Ricky
Ponting’s decision not to enforce the follow-on in the Gabba Test highlights
a new fashion in Test cricket. Traditionally, the follow-on was nearly always
enforced; from 1983 to 1994 it was enforced without fail by all teams. However,
in the last three years, the follow-on has been enforced only 13 times out of
25 opportunities. Ponting’s decision was not unusual except in terms of the
huge first-innings lead: Australia’s lead of 445 is the biggest ever for a
team not enforcing the follow-on, with the exception of one “Timeless” Test
in the West Indies in 1930. ******** Ponting
may have had an eye on the scheduling of back-to-back Tests, with the
Adelaide Test only days away. In 2001, Australia enforced the follow-on at
Kolkata. Not only did Australia lose after India scored 7/657, but the
bowlers still looked tired in the final Test that started only days later.
India won the series 2-1. ******** There is
little evidence that enforcing the follow-on actually works. In the last three
years, teams not enforcing the follow-on have won 83% of the time, but teams
enforcing it have won only 62%. Consider also that teams following on tend to
be in worse positions, with an average first-innings deficit of 327, as
against 256 when the follow-on is not enforced. There may be some benefit to
enforcing the follow-on when time is a factor, but the overall figures simply
do not support the idea that Ponting’s decision was a negative or defensive
one. ******** England
have not been helped by the extraordinary scheduling of this “most
anticipated series ever”. They played just one first-class game before the
series started (plus one other non-first-class warm-up and a picnic match).
The previous all-time low, for a full-length Ashes series, was four
first-class warm-up games, and traditionally, six to eight games were once
the norm. The problem this season results from the absurd scheduling, by the
ICC, of two major One-Day tournaments (the ICC Champions Trophy and the World
Cup) only months apart, putting the squeeze on the Ashes and the traditional
Australian One-Day series. This is spite of the fact that the Brisbane Test
alone may have pulled more spectators than the entire ICC Trophy series.
Today it seems that when (Indian TV) money talks, even the Ashes have to make
way. ******** One
player who looked seriously in need of acclimatisation was Andrew Flintoff.
The Brisbane Test was Flintoff’s 63rd Test, yet it was his first for England in
Australia. This is the longest-delayed introduction to Australia for any
England player, though not quite as delayed as Marvan Atapattu, who played 73
Tests for Sri Lanka before making it to Australia. ******** Looking
for precedents for the Gabba result? England might take a little
encouragement from the 1954 Ashes Test at the ground. Australia batted first,
scored over 600, and won by an innings and plenty, yet it was England who won
the series 3-1, thanks to fast bowlers who found form. A more likely
precedent would be 1946-47, where Bradman’s Australians scored 645 in the
first Test, and were never seriously challenged thereafter, winning the
series 3-0. ******** It is
ironic that it was England who broke a batting record in the Gabba Test:
highest score (370) in the fourth innings of a Test on that ground,
previously 355 by India in 1967/68. England fans looking for rays of hope
might consider that England’s previous effort at the Gabba, in 2002/03, was
the worst fourth innings on the ground since 1936; they were bowled out for
79. ******** Shane
Warne picked up his 300th Test wicket on Australian soil, the first bowler to
do so. At this stage, the tally requires inclusion of that dreadful “World
XI” series concocted by the ICC last season, but it won’t be long before
Shane hits 300 in genuine Test matches too. It is curious that Warne has a
better record away than at home: about 57% of his wickets have been taken
outside Australia, at a better average and strike rate. ******** A report
on TV that Justin Langer is the only Australian apart from Bradman to score
over 20 Test centuries without a score in the 90s is incorrect. Langer scored
a 99 against the West Indies at Adelaide last season. Greg Chappell could
also add that he was never out in the 90s; he did have a 98 not out to his
credit, though. ******** |
||||||||||||||||||||||||||||
|
22 November 2006 If
history is a guide, England has an uphill battle to win the Gabba Test and,
indeed, the Ashes. England’s victories in Australia, in Tests where the Ashes
were still at stake, have been rare going back decades. England did win the
Ashes in 1978/79 and again in 1986/87, both times against teams depleted by
defection (to World Series Cricket and to ‘rebel’ South African teams). There
was one victory at Melbourne in 1982/83, by just three runs. Apart from that,
England’s last comprehensive Test win in Australia against a full-strength
team, with the Ashes still at stake, was in 1971. That
year, 1971, was (unknown at the time) a banner year for Australian Test cricket,
in that seven notable Australian players were born in the months following
the loss of the Ashes: Greg Blewett, Adam Gilchrist, Matthew Elliot, Matthew
Hayden, Brad Hogg, Stuart MacGill, and Damien Martyn. One of them, SCG
MacGill, was even named after the ground where the Ashes were lost. Justin
Langer, Glenn McGrath, Michael Bevan, Damien Fleming, Darren Lehmann, Michael
Kasprowicz and Michael Slater were also born within a year or so of the
summer of 1970-71. Australia’s
team for Brisbane will, depending on final composition, have an average age
of just over 33 years. This will make it the oldest Australian team since
1926, when the team average was about 35 years. That 1926 team was affected
by the almost complete cessation of cricket during World War I from 1914-18,
which drastically reduced the supply of good young players. In short,
Australia has never fielded, under normal conditions, an older team than we
will see this summer. The number of younger players under 25 years is also at
a historic low. The
’Gabba ground has not been a happy one for England. Apart from the ’78/79 and
’86/87 series against a depleted Australia, England have not won a Test at
the ground since 1936, when they caught Australia on a sticky wicket in the
second innings and Bradman was out second ball. England might have preferred
to stick with Brisbane’s other Test ground, the Exhibition Ground, where they
won by no fewer than 675 runs in 1928/29, in the team’s only appearance
there. Patsy Hendren scored more runs than the entire Australian team in that
match. Perhaps
England’s worst experience at the ’Gabba came in 1958/59, when a previously
highly-regarded team put in what could be called a “catatonic” batting
performance. At one point England scored 106 runs in a complete day’s play,
including 19 before lunch, of which Trevor Bailey contributed eight. Bailey
ended up with 68 off 427 balls, including an interval of 198 balls between
boundary hits. To put that in perspective, consider that the no Australian
has taken more than 300 balls to reach a century since Allan Border (314
balls) at Manchester in 1981, and that the slowest century in all Ashes Tests
is 378 balls by Bill Woodfull in 1928/29. In the
five Tests of 1958/59, only one ball was hit for six (by Fred Trueman at
Sydney). If there are any lingering doubts as to how much the game has
changed, consider that 51 sixes were hit in the 2005 series. |
||||||||||||||||||||||||||||
|
10 November 2006 Here is a new list of
the fastest-, and slowest-, scoring batsmen in Ashes Tests. I have set the
qualification bar fairly low (minimum 400 runs) so you can see some recent
players. Few current or recent players make it onto the “slowest” list, not
even Geoff Boycott (rate 34.4 r/100 balls). For those, like me, who only
remember the later Boycott, he was a little more adventurous in his younger
days. An
updated list for all Tests will be posted before long. The database behind it
has been improved bit by bit (almost literally). Balls faced has become
available for a number of previously-missing series, including such
interesting series as 1947-48 Aus vs India, and 1964-65 West Indies v
Australia, and (somewhat less interesting) England’s Tests in New Zealand
from 1950-1966. The total
availability of Balls Faced data in Test innings has risen to 77%, with
Minutes Batted data now extending to 98.5% of individual Test innings (on a
runs scored basis). |
||||||||||||||||||||||||||||
|
For entries April 06 to October 06 click here For entries January 06 to March 06 click here For entries June 05 to Dec 05 click here For entries Nov 04 to June 05 click here |