|
For sportstats home page, and
info in Test Cricket in Australia 1877-2002, click here Z-score’s Cricket Stats Blog Archive –
Apr 2006 to Oct 2006
Who are the Fastest-Scoring
(and Most Tenacious) Batsmen in Test Cricket? Click Here. |
|
||||||||||||||||||||||||||||||||||||||||||||||||||||||||||||||||||||||||||||||||||||||||||||||||||||||||||||||||||||||||||||||||||||||||||||||||||||||||||||||||||||||||||||||||||||||||||||||||||||
|
|
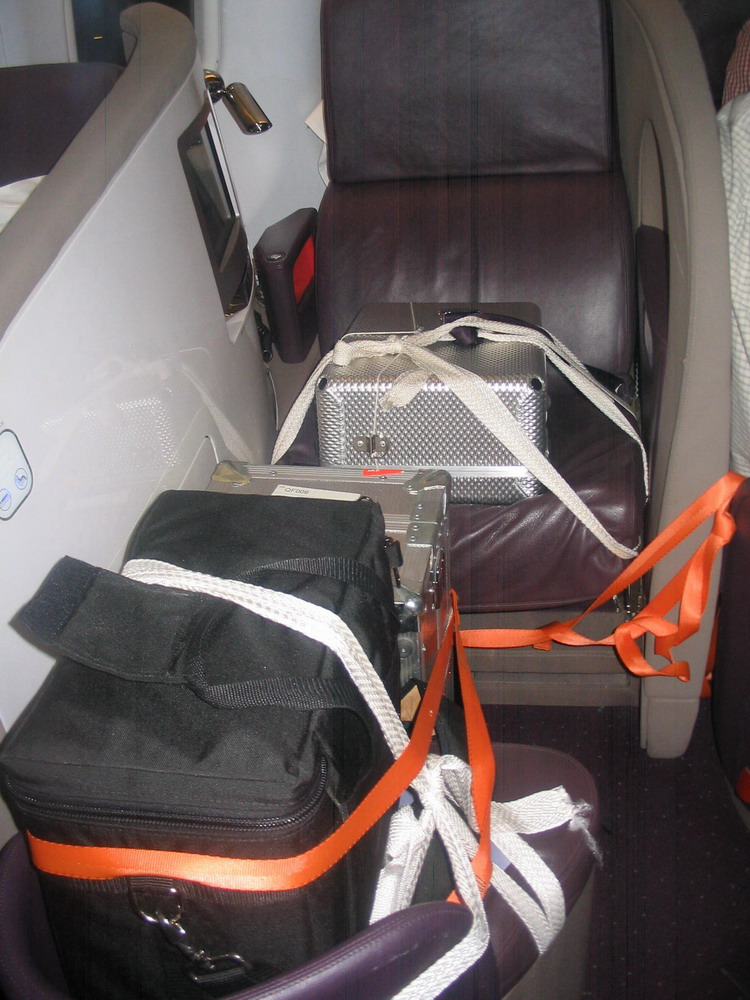
29 October 2006 And now
for something completely different, an exclusive picture of the Ashes, all
packaged up and securely tied into its own (“Upper Class”) airline seat, on
the way to Australia onboard a Virgin Atlantic A340. Courtesy of
my sister, who, completely by chance, travelled in the very next seat the
whole way. Click here. 25 October 2006 How Reliable is the Official
Record? It is
stock-in-trade for sports statisticians to report their results with great
precision. We sometimes forget, when reporting, say, that Allan Border scored
exactly 11,174 Test runs, what a vast amount of observation and recording it
took to support such a figure. We are relying completely on the ability of
scorers to accurately record events all the time, and one would think that
the official scorebooks of matches would be the final arbiter of question
over Test scores. Unfortunately,
close examination of many scores does not inspire as much confidence as
hoped. This comes to light when “re-scoring” old scorebooks to reconstruct
the ball-by-ball events. I have re-scored more than 150 pre-1980 official
scorebooks in this way, and I would estimate that 70% of them contain
anomalies that may be errors, and raise questions about the accuracy of the
reported scores. Sometimes
the problems are overt, such as the Sydney Test of 1903-04, where, in the
scorebook held at the Lord’s Library, the reported scoring strokes of some
major innings do not add up to the totals. Did Victor Trumper score 185 not
out, or (if you add up his scoring strokes) 187 not out? More often, the
problems are subtle, in that the sequence of strokes in the bowling analyses
simply cannot be reconciled to the batting strokes. In one
scorebook from New Zealand 1962-63, the bowling record differed from the
batting record in at least 20 places in a single team innings, and there was
evidence that for several individual innings, strokes has been added at the
end of the batsman’s innings to make it all add up. More
recently, I looked at England’s Test at Karachi in 1972-73. The score is
beautifully written in precise and neat hand, but I have been unable to fully
reconcile the batting and bowling sections. What is unusual is that problems
arise after only a handful of overs, so it makes an interesting example. The
initial scoring strokes for Pakistan’s openers were Sadiq 42143142111 Tillat 11121123212 While the
opening overs (which are numbered) were Arnold 4..2.1
.4…1 .1…2 1….. Greig .nb43…
.1…. 4….. …1.2. Even by
Over #3, the matching of batting to bowling fails, even if one invokes byes,
leg-byes or “one-short”. It may be that there was an incorrectly recorded
change of bowling after the first two overs, but I haven’t found one that
fits, nor did any batsmen retire hurt. Incidentally, the “3” credited to
Tillat cannot be found in any bowler’s analysis. There are in fact more
threes in the batting section than there are in bowling, even though the
strokes in all sections add up superficially. This is
not to argue that the official record should be changed, even though this
might occasionally be of some importance. For instance, Mushtaq Mohammad, run
out for 99, actually made 103 in the re-scored version. However, the
re-scoring is so confounded by repeated anomalies that one cannot suggest a
corrected figure. Totals at falls of wickets are also in question. Wisden discourages post hoc correction
of scores (“That way madness lies”). I
agree, but it is worth remembering, when precise numbers are being
quoted, that the foundation for these may be uncertain. Note:
some scores do not create any problems. For instance, I have re-scored
several scores by the late Geoffrey Saulez and found that they reconcile
completely. Saulez was official scorer for England for many years, but he
apparently did not go on the 1972-73 tour of Pakistan. The Karachi scorebook
in question is not in his hand. 12 October 2006 From Deep in the Vault The name
Clifford Roach is not exactly a cricketing byword, but Roach did have a
notable part to play in the early Test matches of the West Indies. He enjoyed
an excellent series against the MCC in 1929-30 (which later became known as
Test matches). Roach scored the West Indies’ first century in home Test match
when he scored 122 off 190 balls at Bridgetown, followed by a pair of ducks
at Port-of-Spain, and bounced back with 209 at Georgetown. There is little
said about the Georgetown innings in the usual sources – even the report in
the Times was perfunctory, but as it happens, an original scorebook survives
(in the MCC Library at Lord’s). With little to go on, I set about re-scoring
this innings, and it turned out to be quite an unusual innings indeed. Opening
with Errol Hunte, the first session was funereal; just 38 runs were scored
off 35 overs. After lunch, Roach picked up the pace just a little, reaching
his 50 off 165 balls, still slow, but well ahead of Hunte who was eventually
out for 53 off 200 balls with the score at 144. Tea was taken one over later,
150/1 off 69 overs. Roach was 87 and
starting to play strokes. It is
hoped that any spectators bored by such proceedings did not leave at that
point, because Roach transformed his batting after tea, hitting seven fours
in the first five overs, and at one point scoring 51 runs off 23 balls. With
George Headley providing steady support, Roach raced past 150, and with a
little more care, on to 200. He was out to the last ball of the day for 209
in 303 minutes, out of 336 runs off 102.2 overs. Roach
faced 325 balls, which means that he faced fewer balls after reaching 50 than
before. Has anyone else scored a Test double-century in such a fashion? Let
me know if you can think of one (Astle did not, nor did McCabe). Roach
also scored 122 runs off 112 balls in the tea-stumps session, a fact not
previously included in published records. It is worth asking how many players
have scored more runs in a session? Here is an attempt at a list: 173 DCS
Compton (278) Eng v Pak
Nottingham 1954 (lunch-tea) 150 WR
Hammond (336*) Eng v NZ Auckland
1932-33 (lunch-tea) 140 IDS
Smith (173) NZ v Ind Auckland 1989-90 (tea-close) 139 NJ
Astle 222 NZ v Eng Christchurch 2002 (tea-close) 133 VT
Trumper 159 Aus v RSA Melbourne 1910-11 (tea-close: 154min session) 127 ME
Trescothick 165 Eng v Ban Chester-le-Street 2005 (tea-close) (about 140 mins) 127 SJ
McCabe 232 Aus v Eng Nottingham 1938 (lunch-tea) 127 DL
Vettori 127 NZ v Zim Harare 2005 (tea-close: 150 min session) 123 LEG
Ames148* Eng v RSA The Oval 1935 (pre-lunch: 150 min session) 122 CA
Roach 209 Georgetown 1929-30 (tea-close) 121 R
Benaud 121 Aus v WI Kingston 1954-55
(lunch-tea) The exact
time of Roach’s session is hard to gauge, but it was less than two hours,
probably 105 minutes and possibly only 90. This only increases the stature of
the innings, since some of those ahead of Roach in the list had the luxury of
extended sessions. 27 September 2006 Richie Benaud as Daredevil A
perennial problem of making lists of record fastest or slowest innings is the
lack of “balls faced” information for many venerable innings. A particular
example is Richie Benaud’s 121 in 96 minutes at Kingston in 1955. At the
time, Benaud was preoccupied by news of his fiance’s illness back in
Australia, and coming to the crease at a score of 597 for 6, he took a daredevil approach to the
situation. He hit five consecutive fours off new-ball bowler Dewdney and went
on to 100 in 78 minutes, still the second fastest century, timewise, by an
Australian batsman. At one point Benaud scored 47 or 48 off about 3 overs. Not a lot
more is known about the specifics, so can we say anything about the balls
faced? Well, a little. By studying the West Indian over rate that day, 64 overs
in 200 minutes, it is doubtful that more than 25 overs were bowled while
Benaud was reaching that 100. Benaud scored 17 in a 24-run partnership with
Lindwall in about 25 minutes. Lindwall was out during the first over of the
new ball; the bowlers were fast-medium, probably tired and disheartened given
the score, and it was the hottest part of the day. Given the rapid scoring,
the over rate would have dropped during this phase, in all probability. So
let’s say 24 overs were bowled in total during Benaud’s innings, 144 balls. Benaud
was out at 758 for 8, after scoring 104 runs of a 137-run partnership with
Johnson in 70 minutes; Johnson declared, and the score remains the Test
record for Australia. How much
of the strike would Benaud have received? Hard to say. Johnson, the captain,
who scored only 27 not out, almost certainly tried to feed the strike to
Benaud, but there is a countervailing tendency for batsmen who are scoring
very fast to lose the strike. The reason is that a fast scorer facing the start
of an over is much more likely to hit a strike-losing single early on than a
slow scorer, simply because he is playing scoring strokes of all kinds more
frequently. This
tendency can be seen in other super-fast innings. Looking at 12 very fast centuries
(faster than 85 balls) for which ball-by-ball data is available, the average
strike faced by the batsmen in question was 48%. The range was from 38% for a
Shahid Afridi innings, to 58% for Brian Lara’s ton against Australia in 1999.
The standard deviation was 5%. Based on
this, the likely balls faced for Benaud’s first 100 is 69 balls plus or minus
about 14. The likely range, with 95% confidence, is 55 to 83 balls. Given
that we know that Benaud was offered the strike by Johnson, the true figure
seems more likely to be toward the top of this range than the bottom. Still
there is perhaps a 20% chance that Benaud’s ton was faster than Jack
Gregory’s record 67-ball effort at Johannesburg in 1921, and if not, it is
very probably the second-fastest by an Australian, ahead of the best by Adam
Gilchrist and Matthew Hayden, who have both reached 100s in 84 balls.
(Gilchrist, in fact has done this twice.) So, even
though we can’t put an exact figure on Benaud’s innings, we can be fairly
confident of its place among Australia’s cricket records. 6 September 2006 Blast from the Past. When
trying to study in detail the remarkable Tests matches of the past, there an
element of pot luck that applies, in that original scorebooks may or may not
be available, and the detail of reporting from the times is so variable. An
example of a Test that presents a problem is the Oval Test of 1939, the last
before World War II, played only weeks before Hitler’s invasion of Poland. No
original score of this Test survives – possibly lost during multiple moves of
Surrey’s archive when the ground was given over to military use. Of course,
reports of the match survive in Wisden, English newspapers and other
sources, but the reporting style of the day tends to be unhelpful to the statistically
minded. Of particular interest is Learie Constantine’s one great Test
innings, 79 in less than an hour. Can it be studied in detail, and how does
it compare to high-power innings today? Fortunately,
more information can be found in West Indian newspapers. This requires a
visit to the British Library and a bit of patience. Looking at the Jamaica
Daily Gleaner for 1939 revealed a very unusual approach; for most of the
series they had reproduced, in vast reports, the contents of the radio broadcasts
of the time, sometimes word-for-word. This presumably was taken from
short-wave broadcasts, which must have been new-fangled at the time
(Australia had still been using the “synthetic” broadcasts just one year
before). There are random gaps in the reports; perhaps reception was poor, or
the reporters couldn’t stay awake. Unfortunately,
one of the few days where the Gleaner did not report so much detail
was the last day of the series, the day of Constantine’s 79. However, there
is still something to be “gleaned’ from this paper and others, enough to
reconstruct an over-by-over progress for the innings. This is probably best
described as a statistical “impression”; some of the detail is a little hazy. Constantine
came to the wicket just before stumps, after Ken Weekes had struck an amazing
137 in 135 minutes on debut, the only run-a-minute debut century ever. (389
for 6) Constantine scored one in the over and a bit remaining, with Sealy not
out on 17. Sealy faced every ball of the last over. (395 for 6). The next
morning pace bowlers Nichols and Perks took up the bowling with the new ball
due shortly. Nichols bowled to Constantine.
Note that dot-balls are omitted. Nichols
(29th over) Constantine 4,4,2, now 11*. Perks (26th
over) Constantine 4,1,1, now 17* (Sealy 1,4,1) Nichols
(30, new ball) Constantine 2,4,1,1, now 25* (Sealy 1, and 4 leg-byes) Perks
(27) Constantine 4, now 29* Nichols (31), Sealy out for 24 (434 for 7). Constantine 4,1,1, now 35* (Martindale 1,1) Perks (28), Constantine 2,4,1,1, now
43*. (Martindale 1, and out for 3, 451 for 8.) Nichols
(32) Constantine 3,4,4, now 54*. (Clarke 1.) Constantine had reached 50 in 30-35 minutes
off about 40 balls. Perks
(29) Constantine 2,6,1, now 63*. (Clarke 1.) Constantine’s six was hit off the back foot
over the longest boundary on the ground and flew into the pavilion. It was
regarded at the time as one of the longest hits ever seen at the Oval.
Hammond by this time had placed up to six men on the boundary. Clarke, who had scored another single, was out for 3 late in the over. (475 for 9.) Nichols (33) Constantine 1,2,1 now 67*. Johnson 1. (Guesswork: this over has very little description). Perks
(30) Constantine 4,1, now 72*. (Johnson 4.) Nichols
(34) Constantine 1,1, now 74*. (Johnson 1,2) Perks (31) Constantine 4,1,
(Johnson 1) then Constantine out, caught by Wood, off a hook shot off the 5th
ball. Johnson 9*. West Indies all out 498. Constantine’s
79 came in 56-58 minutes off roughly 63 balls, with 11 fours and a six. He
had scored at least four runs in each and every over of the morning bar one. |
||||||||||||||||||||||||||||||||||||||||||||||||||||||||||||||||||||||||||||||||||||||||||||||||||||||||||||||||||||||||||||||||||||||||||||||||||||||||||||||||||||||||||||||||||||||||||||||||||||
|
|
14 August 2006 What has happened to
ODIs?
The
ICC policy of allowing “Associate”
countries to play more ODIs, introduced early this year, is really starting
to bite, even distort, the ODI program. Briefly, Kenya, Scotland, Ireland,
Canada, Bermuda and the Netherlands now all have ODI match status whenever
they play each other or a Full member. The teams have taken to the new status
with gusto. As of
today, the last 14 ODIs in a row have all involved at least one country that
is not currently Test-ranked (including Zimbabwe here). In only 10 of the
last 36 ODIs have both teams enjoyed full Test status. Apart
from the effect on standards (the all-time record score has already been
broken in one such match), there is a bit of a problem for stats-keepers.
Even with its resources, Cricinfo is not able to report many of these games
in its customary detail. (Many recent ODIs have not even made it onto
Cricinfo’s “front page”). As a result, lesser records become hard to
identify. Sanath Jayasuriya possibly set a record for the fastest 150 in ODIs
against Netherlands in July, but the exact number of balls faced for the
first 150 is hard to find. We may
see a split in record-keeping for ODIs, with games between Test-ranked
nations given a higher, if quite unofficial, status in the record books. The Most Patient Bowlers
Paul
Collingwood recently had to wait until his 381st ball in Test
cricket before taking his first wicket. As it happens, this, or worse, has
happened to a fair number of bowlers over the years. Making a definitive list
of the slowest bowlers off the mark is difficult, because the placement of
wickets within long innings cannot be precisely made without a complete
scorebook. Nevertheless,
here is a list of those who have probably bowled more than 500 balls in Tests
before their first wicket. It include several players whose tallies can only
be estimated. AG Kripal
Singh: 651 balls. Kripal Singh was regarded as an all-rounder, but his
bowling in Tests never made the grade. He took his first wicket in 1961-62,
in his 10th innings of bowling for India, conceding 235 runs up to
that point. His first wicket was Geoff Pullar. JJ Warr:
551 balls. Warr’s unsought fame lies in his career bowling average of 281.00.
His only wicket, Ian Johnson, came in his last Test in 1951. RGCE
Wijesuriya: 540-560 balls. Don’t know much about this guy. He “beat” Warr’s
record bowling average, finishing on 294.00. IM Chappell:
536 balls. Chappell became an occasionally useful part-time spinner, but he
didn’t have much luck early. PR
Umrigar: 500-550 balls, hard to be more precise with this one. JC
Alabaster: 510-522 balls. Most highly rated bowler on this list. Took 49 Test
wickets. His susequent strike rate was 71 balls per wicket. Honourable
mention: Kerry O’Keeffe became a respected bowler for a while in the
Australian team, but he didn’t take a wicket until he had bowled 442 balls. The
longest wicket-free bowling career was JL Hopwood of England, 462 balls in
1934. 14 July 2006 The blog has been quiet due to a sojourn in Europe, partly in the UK, where the opportunity was taken to obtain more copies of old scorebooks. One old record I happened upon was a ball-by-ball score of Dennis Compton’s 300 vs Northern Transvaal in December 1948. This has long been known as the fastest triple century in first-class cricket, at 181 minutes, but how many balls did Compton face, and how does it compare to some other very fast innings? Two other great innings that I have re-scored are Charlie Macartney’s 345 vs Notts in 1921, and Victor Trumper’s 293 against Canterbury in 1914. Remarkably, in one sense it can be said that all three innings were scored by the same man, the well-travelled Australian scorer Bill Ferguson. Compton’s innings was especially manic in its latter stages. 120 not out overnight, he added 180 runs in the next 95 minutes before being out before lunch. In 13 overs, Compton scored 136, off 75 balls, out of the last 150 runs of a 399-run partnership with Reg Simpson. Simpson, for his part, scored in nothing but singles in this period, simply feeding the strike to Compton, facing only 30 balls to Compton’s 75. Compton at one stage added 121 runs off 57 balls, before slowing a little as he approached the 300 mark. He went from 164 to 265 off 44 balls. Overall, though, Compton’s scoring is just a little slower than might be expected, thanks to that strike-farming. His 300 was reached off 261 balls, slower than Macartney’s 221 balls, even though Macartney took 25 minutes longer over his runs. Macartney was a good deal faster going from 100 to 200, and apparently made little effort to farm the strike. Surprisingly, AW Carr’s bowling figures of 1-0-24-0 (6 x 4s) were not the work of Macartney, but of Nip Pellew, who scored 100 off 104 balls. Here is a comparison of the progress of several “super innings”, very big and very fast.
One curiosity that sometimes arises from re-scoring old scorebooks is that the score obtained does not tally. Re-scoring the bowling from Macartney’s innings produces a score of 343 rather than 345, and Trumper now weighs in at 294. Which are correct? It doesn’t matter much (to me, at least), with little or not effect on the balls faced figures above, since most milestones were reached with boundary hits. Fortunately, Compton’s score comes to 300 exactly. There are other candidate innings that could threaten the status of Macartney as the fastest triple-centurion. Ken Rutherford scored 317 off 245 balls at Scarborough in 1986, reaching his 300 off about 230 balls. Don Bradman (369 v Tasmania in 1935-36) and Frank Woolley (305 v Tasmania in 1912) may have reached 300 off 215 to 230 balls. I will update this if I can get any hard numbers. |
||||||||||||||||||||||||||||||||||||||||||||||||||||||||||||||||||||||||||||||||||||||||||||||||||||||||||||||||||||||||||||||||||||||||||||||||||||||||||||||||||||||||||||||||||||||||||||||||||||
|
|
25 May 2006 Two sort-of new articles in the “longer articles” section: The Last Shall Be First. An unpublished analysis of the advantages, or otherwise of winning the toss and the choices captains make. Written last year, the data are only current to 2005, but the trends have not changed since. Page Inserts For Wisden
Australia 2005-06. This
is material published in Wisden Australia 2005-06. It covers the same ground
as some items in the blog, but there is some new material here. Again, data is
current to mid-2005 only.
11 May 2006 The Hot 100 list of fastest batsmen, and the associated lists, have been updated. Mike Hussey now qualifies for the list, having scored his first 1000 runs in Tests faster than any batsman in history (measured in time from debut). Hussey is currently the only batsman apart from Bradman to appear on both the “fastest” (#63) and “most tenacious” (#8) lists. Doing this requires an extreme batting average, and at 75.9, Hussey is certainly achieving that so far. 3 May 2006 The question of the identity of the slowest batsman in Test cricket has taken quite some time to resolve, and the answer, as so often, seems to be “it depends”. Among batsmen who scored over 1000 Test runs, Alec Bannerman, the 19th-century stonewaller, appears to hold the title. Bannerman scored at between 22 and 23 runs per 100 balls. The uncertainty is due to the fact that we don’t have a complete record of Bannerman’s career in balls faced, but enough is available to narrow down the possibilities to that range. Bannerman’s greatest tour de force was an innings of 91 he played at the SCG, where he faced 620 balls. Compare that to the slowest 100 in Australia, 378 balls by Bill Woodfull in 1928-29, a record that Bannerman would probably hold except that he never made a Test century. Among cricketers who didn’t make the 1000-run mark, but still had careers of some significance, there is a batsman who was slower still. Geoff Rabone, who died this year, more than 60 years after bailing out of a burning bomber in World War II, captained New Zealand at one time, and became the ultimate 1950s-style stonewaller. Recently some new data has been teased from some old scorebooks, giving a clearer idea of his scoring rate. Rabone scored only 562 runs in Tests, but spent more than 40 hours at the crease in total. His career, innings by innings, is as follows:
Figures
in brackets indicate estimated Balls Faced derived from time at crease, and
prevailing over rates. Rabone took 357 balls to
reach his only Test century. The above data produces a scoring rate of 21.8
runs per 100 balls, just below the range we have for Alec Bannerman and his
English counterpart WH Scotton. Rabone faced 143 balls per dismissal, on
average, putting him seventh on the all-time list of most tenacious batsmen,
even though his batting average was only 31.2. Rabone’s last innings
came during the record-breaking rout New Zealand suffered at Auckland in
1954-55, all out for 26; Rabone’s 7 was second-top score. Those 26 runs took
27 overs, spanning almost 2 hours. Those were dark days for New Zealand
cricket. On a vaguely related
topic, here is a list of the fewest boundaries hit by players on reaching a
Test 100. Some of these innings have not previously been recognised as being
so boundary-deficient. Surprising to see the Don on this list.
|
||||||||||||||||||||||||||||||||||||||||||||||||||||||||||||||||||||||||||||||||||||||||||||||||||||||||||||||||||||||||||||||||||||||||||||||||||||||||||||||||||||||||||||||||||||||||||||||||||||
|
|
22 April 2006 A few notes on Jason Gillespie’s epic double-century. One might begin (for those who suggest that extreme performances against Bangladesh are meaningless) by noting that Bangladesh had gone throught their previous ten Tests without conceding a double-century, the previous one being the work of Sachin Tendulkar in 2004. Notable batsmen whose highest Test scores are less than Gillespie’s:
(Steve Waugh reached 150 fourteen times in Tests.) Gillespie is the only player in history whose only first-class century is a Test double-century. Gillespie’s innings was 12.8 times his batting average going into the Test; after the double century this ratio dropped to 10.7. The only player to finish a career with a higher ratio (of top score to average) was Wasim Akram, with a ratio of 11.35 (average 22.6, HS 257*). Gillespie’s top score is also now 7.6 times his bowling average. The only players (with more than 100 wickets) who can top this ratio are Wasim Akram (again) and Garfield Sobers. Mohan Menon has pointed out that Gillespie joins Worrell, Botham and Wasim Akram to become the fourth player in test history to open the bowling after scoring a double ton. Gillespie, Botham and Wasim Akram are the only players to score 200s having already taken over 200 Test wickets. Gillespie made his first Test century in his 92nd innings, the longest wait for any player; previously Heath Streak of Zimbabwe, 90 innings. Batting average of all nightwatchmen is normally about 15. Historically, the batting average of nightwatchmen is no higher than for the same batsmen in their normal batting positions. The definition of a nightwatchman is somewhat loose, although we can usually recognise one when we see one. The previous highest score by a genuine tailender coming in to bat at #5 or higher, just before stumps, was 105 by Tony Mann against India at Perth in 1977-78. Andrew Hall made 163 for South Africa as a makeshift opener in 2004. Gillespie reached 100 off 296b, the slowest for Australia since Mark Waugh faced 299b at Adelaide 1997-98 vs S Africa. Gillespie’s 200 off 425b was the slowest for Australia since Steve Waugh faced 426b at Kingston 1995 vs W Indies, and the fifth-slowest overall. Gillespie is only the second Australian, and the third player overall, to have his first innings spread over the first four days of a Test. The others were Dean Jones(157) at Edgbaston in 1989, and Herschelle Gibbs (228) at Christchurch in 1999. Naturally, all these example were from Tests heavily affected by rain, but Tests with days completely washed out are excluded. UPDATE: Sreeram points out that Ravi Shastri also did this at Calcutta in 1984-85. (My search had only looked for players scoring runs on all four days, and Shastri batted, but did not score, in the four overs bowled on the second day.) To answer a query from Carl, here is a list of largest differences between career top score and second top score in Tests:
14 April 2006 The unexpected – well, extraordinary – course of Australia’s first Test in Bangladesh has led to plenty of comment on the team’s pressurised schedule. Australia was allowed only a five-day gap between the last Test in South Africa and the first in Bangladesh. This is the shortest interval between Tests played on different continents that any team has had to cope with. India, in 1979, played Tests a week apart in England and India, but at least they were returning home for the latter Test. Few teams have scored more against Australia on the first day of a Test than Bangladesh scored at Fatullah. The biggest totals since 1940 are:
Only two of these cases occurred since over rates plummeted in the 1970s. There are a number of other instances from before 1940, but nearly all involve days when over 110 overs, sometimes over 130 overs, were bowled. Burnout or lack of commitment? The combined bowling figures of Australia’s first-choice bowlers, Lee, Clark and Warne, came to a nice round figure of 0 for 250 in Bangladesh’s first innings. This failure of Australia’s top-line bowlers produced a surprising rarity: our only wicket-takers, Stuart MacGill and Jason Gillespie, had not played in the previous Test in Johannesburg. Indeed, neither had been selected in the three Tests in South Africa. Apart from the Packer upheaval, this has happened to Australia only twice in the last 100 years. In 1953, Australia’s wicket-takers in the first Test at Nottingham, Davidson, Hill and Lindwall, had not played the last Test against South Africa; selectors in those days sometimes omitted established players at the end of a series, to try out some fresh blood. At Rawalpindi in 1998, none of Australia’s wicket-takers had played in the team’s previous Test at Bangalore. Adam Gilchrist scored 53.53% of Australia’s runs in the first innings – 144 out of 269. This is the second-highest percentage ever achieved by a number 6 batsman in Tests, behind 59.5% by Mark Burgess for New Zealand in Pakistan in 1969 (119* out of 200 all out). Curiously, Gilchrist is just 0.03% ahead of Tatenda Taibu, who just a year ago scored 53.50% of Zimbabwe’s runs, also against Bangladesh, batting at number 6 (153 out of 286). Gilchrist took 163 balls to reach his century, which actually makes it the slowest of his 16 Test centuries (previously 100 off 143 balls at the Gabba in 2001-02 vs New Zealand). For an indication of just how fast Gilchrist normally scores, consider that his previous 15 centuries were all faster than Don Bradman’s famous century before lunch, at Leeds in 1930 (100 off 146 balls). Looking back to the last Test in Johannesburg, Justin Langer became the first Test batsman to retire hurt after after his team’s first ball. He is only the second batsman to retire hurt after facing only one ball and not return to the crease later in the innings. The other was Barry Jarman, the Australian wicketkeeper, who retired hurt after one ball at Lord’s in 1968. Some other batsmen have retired hurt after one ball, and returned later in the innings, but the number is difficult to determine. One was Peter Parfitt, who retired with a broken finger after one ball, at Leeds in 1964. Parfitt actually scored one run for the “stroke”. |
||||||||||||||||||||||||||||||||||||||||||||||||||||||||||||||||||||||||||||||||||||||||||||||||||||||||||||||||||||||||||||||||||||||||||||||||||||||||||||||||||||||||||||||||||||||||||||||||||||