For sportstats home
page, and info in Test Cricket in Australia 1877-2002, click
here
|
|
Z-score’s
Cricket Stats Blog The longest-running cricket stats blog on the Web
|
|

Charles Davis: Statistician
of the Year (Association of Cricket Statisticians and Historians)
|
Who are the Fastest-Scoring (and Most Tenacious) Batsmen in Test
Cricket? Click Here. |
Longer articles
by Charles Davis Click Here |
A list of
“Unusual Dismissals” in Test matches |
Unusual Records. For Cricket Records you
will not see anywhere else, Click Here |
|
|
|
|
|
|
|
|
some
remarkable first-class innings, re-scored. |
The Davis Test Match Database Online. Detailed scores for all Tests from 1877 to the 2010s have now been
posted. More than three-quarters of Tests include ball-by-ball coverage;
virtually all others offer some degree of extended detail, beyond anything
previously made available online. The starting page
is here. An information page outlining
this database is here. Major Test
Partnerships (200+) 1877 to 1970. Major Test
Partnerships (200+) 1971 to 1999. |
|||
|
The first over of the 1977-78 NZ v Eng series was
a 10-run maiden bowled by Bob Willis. The runs were all byes. It was an
8-ball over. This has recently been matched in a 6-ball over
by SC Kuggeleijn against Australia at Christchurch
in 2024 with 4 byes and 6 leg byes. |
|
|||||||||||||||||||||||||||||||||||||||||||||||||||||||||||||||||||||||||||||||||||||||||||||||||||||||||||||||||||||||||||||||||||||||||||||||||||||||||||||||||||||||||||||||||||||||||||||||||||||||||||||||||||||||||||||||||||||||||||||||||||||||||||||||||||||||||||||||||||||||||||||||||||||||||||||||||||||||||||||||||||||||||||||||||||||||||||||||||||||||||||||||||||||||||||||||||||||||||||||||||||||||||||||||||||||||||||||||||||||||||||||||||||||||||||||||||||||||||||||||||||||||||||||||||||||
|
I was informed recently the domain name for this
website was in danger of being taken away because I had not kept my ABN (Australian
Business Number) current. I had no idea that one needed an ABN in order to keep a “.com.au”
address. I had let my ABN lapse when I retired. I have now reactivated my ABN (costing hundreds
of dollars). I hope that this is sufficient to keep this website online. I
have always kept up with my domain hosting fees, but apparently that is a
separate issue to the ABN thing. I am glad that they warned me, but it is
disturbing to know that my entire website could be wiped out at the click of
a mouse by someone I do not know, over an issue like this. For any readers who find useful stuff on my
database, I suggest downloading anything of value whenever you come across
it. ******** In the Nottingham Test, Zak Foulkes of New
Zealand came into the game as a concussion substitute for Blair Tickner and
proceeded to take six wickets in the match. This is the most wickets by a
full substitute in a Test; in fact, there are only a couple of prior cases of
substitutes taking any wickets at all. The most runs by a full substitute was by Marnus
Labuschagne (59) at Lord’s in 2019, the first case of the concussion
substitute rule being implemented. Marnus substituted for the concussed Steve
Smith. ******* Once in every 50-100 Tests or so, a batsman tries
to get off the mark but only succeeds in running his partner out. Happened to
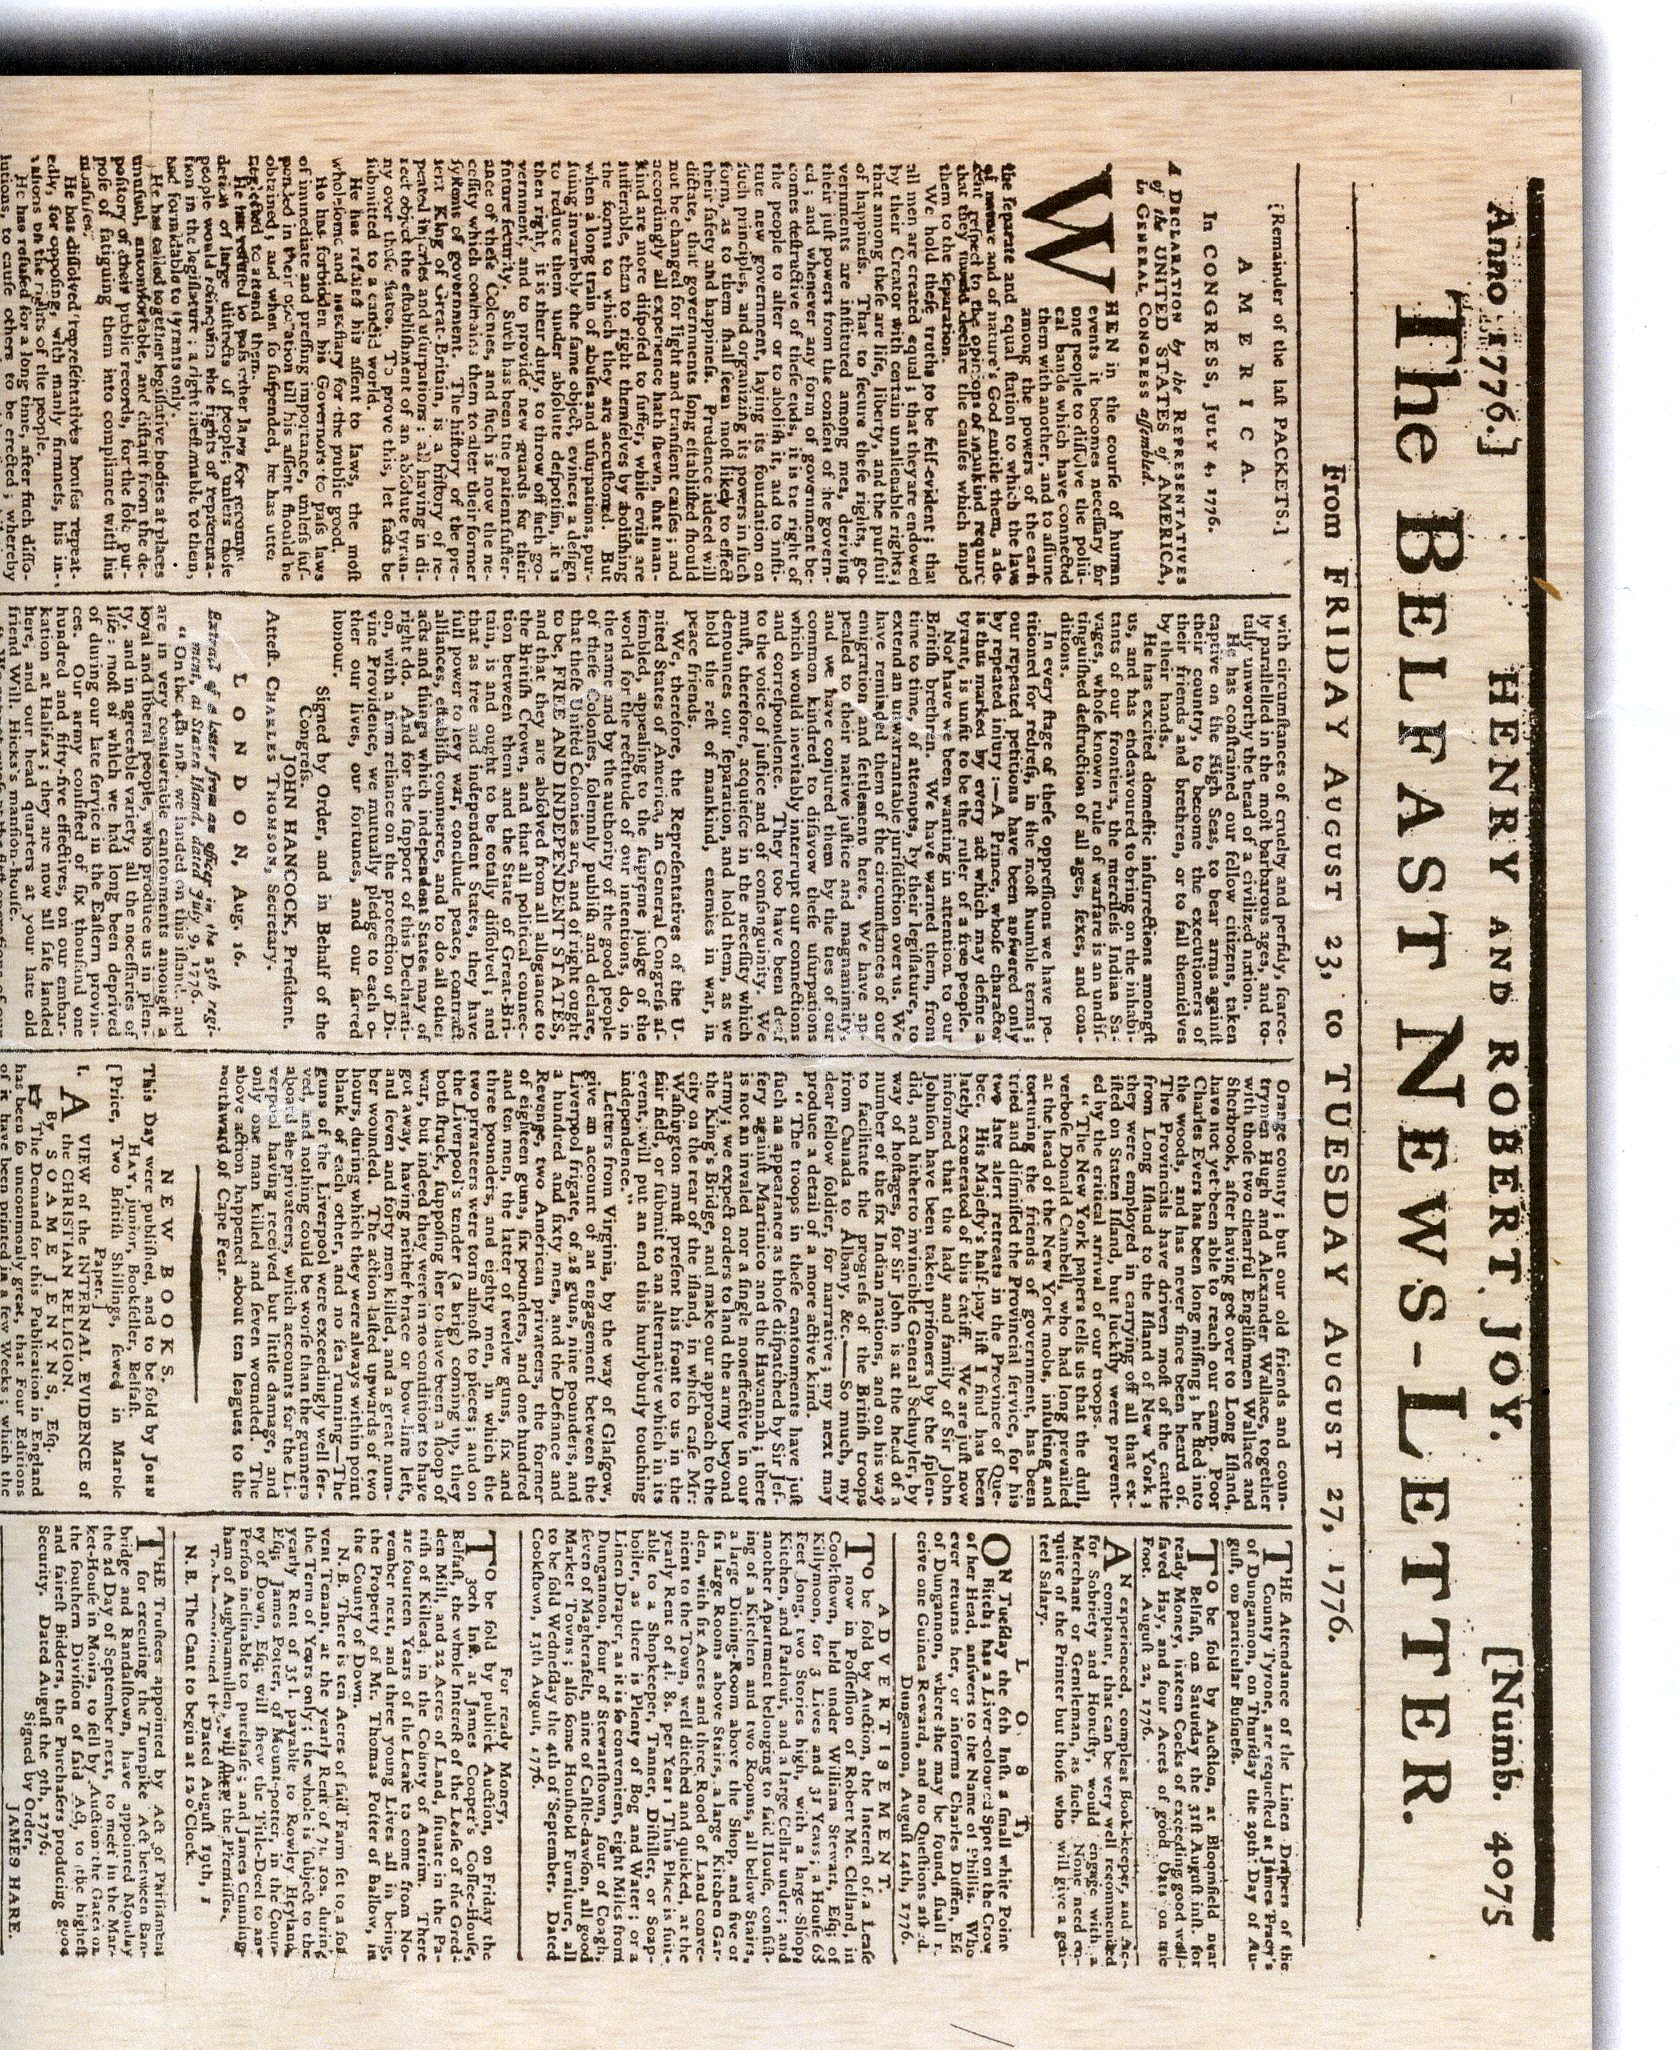
Joe Root at Trent Bridge when Jamie Smith was trying to get off 0. ******** Here is an interesting little non-cricket item concerning
a certain ‘declaration’ apropos of a recent 250th anniversary. Barry Valentine, when he visited Melbourne, gave
me a copy of this page from an Irish newspaper from 23
August 1776. It contains a complete transcription of the American Declaration
of Independence promulgated just six weeks earlier. Barry told me that this
was the first time anywhere that the Declaration had been published. All earlier
copies were hand-written. At the time it took four weeks minimum for ships
to cross the Atlantic, so this Belfast News-Letter
must have wasted no time getting it into print. The Irish, of course, had no
love for the British, so they must have been delighted by the Declaration. I saw that Jefferson and Adams, the writers, had
an argument over the word "inalienable" or "unalienable".
Whoever transcribed this has chosen the latter. ******** |
11 July 2026 In 2019 I did a bit of a comparison of keepers in
terms of catches dropped. Here is a quick update of keepers, now covering a
quarter of a century, in terms of per cent chances dropped (a percentage of
total chances including those taken), which you might find interesting. 21st Century Keepers: % missed chances
in Tests
Early 2001 to Jan 2026, minimum 50
dismissals. Includes missed stumpings. (39 keepers qualify) It may look a little odd that the top two spots are
Australian. However, the keeper in between Nevill and Paine, Matthew Wade,
was much less effective at 18.1% misses. I did a little calculation to compare the overall effectiveness
of these three keepers. Subtract the runs cost of their dropped catches from
their runs scored in the same Tests. Per Test the results were Nevill +21 runs per Test. Paine +24 runs per Test. So even though he scored a lot more runs per Test,
Wade was a net less effective overall contributor than Nevill. In reality the selectors recognised this, and eventually
replaced Wade with Paine as keeper, even while keeping Wade in the team as a
batsman. (Wade’s Tests as a pure batsmen are not
included in the above figures). ******** A new piece of information about the origins of the
'Mexican Wave’. After watching (on TV) the start of the World Cup
the other day at the former Estadio Azteca in Mexico, I was reminiscing about
the time I attended the
opening game of the 1970 World Cup at the same
stadium. Talking with my sister, she told me that although she had not been to
the 1970 World Cup, she had been to the opening game in 1986 at the same
stadium. I had known that she went to the tournament but not that she had
been to the opening game. Pam said that the Mexican Wave was used at that
game. That much was no surprise but she also said
that it was all pre-planned. Spectators going in were handed leaflets
explaining how to do the wave. Initially it was called the "Coca Cola
Wave" (La Ola de Coca Cola). Coca Cola had produced the leaflets. The Wave had been used at various sporting events in
the US for a few years previously. Various people had claimed to have
invented it, but it appears that in the early years crowds has
to be 'coached' how to do it. Thanks to the World Cup the idea spread quickly
after its use in Mexico. Within three weeks, it was apparently used, without
prompting, at a cricket Test match at Leeds. Frindall's score for that Test
includes a note of "Mass Sectional Crowd Waving". So we can thank, or blame, the marketing department of
the Coca Cola company for the wave that went around the world. This reminds
me of the ‘traditional’ image of Santa Claus; the familiar red outfit with
white fur trim and long white beard was actually dreamed
up by Coca Cola for an advertising campaign. An account of some of my experiences in Mexico is at
the link. ******** |
|||||||||||||||||||||||||||||||||||||||||||||||||||||||||||||||||||||||||||||||||||||||||||||||||||||||||||||||||||||||||||||||||||||||||||||||||||||||||||||||||||||||||||||||||||||||||||||||||||||||||||||||||||||||||||||||||||||||||||||||||||||||||||||||||||||||||||||||||||||||||||||||||||||||||||||||||||||||||||||||||||||||||||||||||||||||||||||||||||||||||||||||||||||||||||||||||||||||||||||||||||||||||||||||||||||||||||||||||||||||||||||||||||||||||||||||||||||||||||||||||||||||||||||||||||||
|
Only one Test has seen five instances of bowlers
taking five or more wickets in an innings: Sheffield 1902. Barnes 6/49,
Saunders 5/50, Noble 5/51 and 6/52, Rhodes 5/63. |
14 June 2026
Sreeram has alerted me to an X post that identifies
a previously unknown ball-by-ball account of the Nottingham (first) Test of
1899, as published in the Nottingham Journal. I don’t know who exactly
found this source or made the post. (UPDATE: it is an X account by Tom Ford.) This is one of many Tests of the 1890s that had been
missing from the bbb database, as no full scorebook for this match is known.
A tour scorebook from the 1899 tour exists in Australia, but it is a re-copy
that lacks any detail in the bowling section of the matches.
from Nottingham
Journal, 2 June 1899 The text that I have included in the snip is of some
historical interest. The earliest known moving pictures of a Test in England
are from this Test, and it appears that this article made
reference to those films, although the technology was so “novel” that
it uses the term “animated pictures”. I wonder if the players actually saw the films. Historically, the match is of some importance, being
the last Test for WG Grace and the first for Victor Trumper and Wilf Rhodes. The relevant web pages for the series have been
updated. Found here. ******** A Brief History of the Reverse
Sweep An apparent reference has surfaced describing early
examples of reverse sweeps in 1906, found in a book about England’s tours to
South Africa by Odenhaal and Barry (2023). The
shots are credited to E.G. ‘Teddy’ Wynyard (Boer War veteran and Army
Captain) in the first Test of the 1905-06 series. The Johannesburg Star
is given as the source. I also happen to have a copy of the Natal Mercury
for that Test and indeed there is mention of Wynyard playing a shot
“left-handed”. This seems like pretty good confirmation, although it is not absolutely clear if the shot was a reverse sweep or a
switch hit. I’ll go with the former for now. There are sporadic references to possible reverse
sweeps going back as far as 1870, but the 1906 case is the earliest reference
that I have seen in a Test match. It appears that the shot was invented and
reinvented multiple times long ago, but for decades never caught on. The name
“reverse sweep” only emerged in the 1970s; this makes identifying earlier
example tricky. Some early mentions of (apparent) reverse sweeps in
Tests: -
EG Wynyard at Wanderers 1906 as described. -
Percy Fender Manchester 1921. -
Mushtaq Mohammad. Mushtaq appears to be the first batter to use the
shot on a semi-regular basis, from 1964 onwards. There is a definite
reference to the shot in the Dunedin Test of 1972-73, during Mushtaq’s 201. -
Viv Richards 1974-75 (Mumbai). -
Although there are claims that Greg Chappell never used the shot,
there is mention of a ‘back-handed sweep’ by Chappell at Auckland in 1977. A Birmingham Post article in June 1975
referred to Mushtaq’s “famous reverse sweep”. This is the earliest reference
to the actual term that I have seen. The term also turned up in reference to
Derek Randall in 1977 (not in a Test); most occurrences of the term in
English papers in the early 80s refer to Ian Botham or Mike Gatting. The Times
of India mentions a reverse sweep by Botham in the World Cup in 1983. I
did not find the term in the Sydney Morning Herald or The Age
before 1985. I am indebted to Sreeram once again for some of this
information. ******** |
|||||||||||||||||||||||||||||||||||||||||||||||||||||||||||||||||||||||||||||||||||||||||||||||||||||||||||||||||||||||||||||||||||||||||||||||||||||||||||||||||||||||||||||||||||||||||||||||||||||||||||||||||||||||||||||||||||||||||||||||||||||||||||||||||||||||||||||||||||||||||||||||||||||||||||||||||||||||||||||||||||||||||||||||||||||||||||||||||||||||||||||||||||||||||||||||||||||||||||||||||||||||||||||||||||||||||||||||||||||||||||||||||||||||||||||||||||||||||||||||||||||||||||||||||||||
|
******** I have
updated a list of Most consecutive balls faced without scoring, extending
it down to 50 balls. Most of this data is from the ball-by-ball database.
There are probably other cases where bbb data is not available. There is also
some uncertainty over cases drawn from non-bbb data, but which probably
belong on the list. ********** |
30 May 2026
Following up a question, I took a
look at individual bowlers and their performances against left-hand
and right-handed batsmen. This requires ball-by-ball records to produce the
most useful results. Most bowlers do better against RH than against LH.
Note that LH bats have a better overall average than RH bats; a major factor
is that far more tailenders bat RH than LH.
Benedict asked me about the players who were ‘involved’
in the most balls in Test matches. Taking this to mean the sum of balls faced
and balls bowled, this was an easy list to make. Strictly speaking one could
include balls as non-striker and number of balls fielded – that would make it
much more difficult, probably impossible. The stat favours bowlers, because in a typical Test
innings the balls faced are shared among eleven bats, but only five or six
bowlers. Not many current bowlers on this list.
Only five players have faced more than 10,000 balls and also bowled 10,000 balls in Tests.
******** |
|||||||||||||||||||||||||||||||||||||||||||||||||||||||||||||||||||||||||||||||||||||||||||||||||||||||||||||||||||||||||||||||||||||||||||||||||||||||||||||||||||||||||||||||||||||||||||||||||||||||||||||||||||||||||||||||||||||||||||||||||||||||||||||||||||||||||||||||||||||||||||||||||||||||||||||||||||||||||||||||||||||||||||||||||||||||||||||||||||||||||||||||||||||||||||||||||||||||||||||||||||||||||||||||||||||||||||||||||||||||||||||||||||||||||||||||||||||||||||||||||||||||||||||||||||||
|
After his first innings at Nottingham 1947, Bruce
Mitchell waited about 520 overs before he batted again. The exact number is
not known but 520 can be reasonably be estimated. Kanhai at Bridgetown 1958
was probably a little under 500 overs. (UPDATE: 520.2 overs for Mitchell,
exact number) https://www.sportstats.com.au/zArchive/1940s/1947ES/1947ES1.pdf https://www.sportstats.com.au/zArchive/1950s/1957WP/1957WP1.pdf ******* Here is a posting (elsewhere) by Sreeram. I hope he
doesn’t mind me copying it. “There is an often repeated
statement that Madan Lal bowled the first ball of the world cup. The problem
with this is that there were four matches on that day and the first ball
could have been in any of them… “[However, there is a] news report that the
Lord's clock on this day was three minutes fast. Does not necessarily prove
anything but may slightly enhance the Madan Lal claim to being the first… “… the next paragraph says (after talking about
Amiss missing his hundred because of the early lunch) : "Those who go in
for clock watching at that time of the morning might have noticed that the
game started early so presumably Amiss had the full two hours" ******** |
24 April 2026
I recently updated my ‘appeals’ file, which I have
been keeping for a quarter-century now, where I identify as many balls as
possible that contained an appeal by the bowling team (Tests only). To do
this, the Cricinfo texts were searched for mention of appeals, ‘shouts’ or the many euphemisms that commentators use. It
is remarkable how many different terms crop up. They include… … beg, bellow, beseech, enquire, implore, plead,
polite enquiry, roar, scream, screech, squawk, squeal, whisper, yell, and
yelp. Overall (since 2000) about one-third of appeals
result in a wicket, including those that go through review. (This assumes
also that all batsmen out lbw, caught behind or caught at short leg, have
been subjected to an appeal.) There has been a slight trend in the success
rate of appeals. From 2001 to 2005, about 31 per cent were successful, while
from 2021 to 2025, the figure has risen to 35 per cent. There has been a parallel
decline in the number of appeals per Test, from around 46 per Test in the
early years of the century, to around 41 in this decade. The reasons for this
are not clear to me: there was not step change around 2009 (introduction of
DRS) but there was such a change around 2020. Appeal Success Rates by Team 2000-2025
Here are the Top 10 ‘most appealing’ bowlers, since
2000. Note that Murali leads even though one-third of his career is missing
from the data.
The most successful bowlers, when it comes to
appeals, are all pace bowlers. (Note once again that only about half of
McGrath’s career is represented).
Minimum 250 appeals The pace bowler with the lowest success rate was
Zaheer Khan on 27 per cent. At the other end of the scale there are only
spinners. Anyone who saw the excitable Monty Panesar in action won’t be
surprised at this list. Lowest Appeal Success Rate
The spin bowler with the highest success rate is
Shakib al Hasan on 37 per cent. Interesting in light of
Bangladesh’s low success rate of 29 per cent. ******** |
|||||||||||||||||||||||||||||||||||||||||||||||||||||||||||||||||||||||||||||||||||||||||||||||||||||||||||||||||||||||||||||||||||||||||||||||||||||||||||||||||||||||||||||||||||||||||||||||||||||||||||||||||||||||||||||||||||||||||||||||||||||||||||||||||||||||||||||||||||||||||||||||||||||||||||||||||||||||||||||||||||||||||||||||||||||||||||||||||||||||||||||||||||||||||||||||||||||||||||||||||||||||||||||||||||||||||||||||||||||||||||||||||||||||||||||||||||||||||||||||||||||||||||||||||||||
|
I have bought a book “Test Cricket Cavalcade
1877-1947” by E.L. Roberts (2nd edition 1948). The book claims to
be the first compilation of the complete ‘canon’ of Test matches, and I have
no reason to doubt this. The first edition in 1947 had omitted the Test in
New Zealand in 1946, but this had been granted Test status by 1948. ******** |
22 March 2026
I have completed an annual search for missed chances
in Test matches. The search has used the same technique on the Cricinfo texts
since 2002 (and some Tests earlier), flagging balls that have all manner of
synonyms and euphemisms for dropped catches, followed by individual checking
of all ‘hits’. My favourite description this year
was of a fielder who “shells an absolute soda”. (It would be much simpler if
the commentators would simply use the word “Dropped” whenever it happens.) For 2025, Australia performed best, after a couple
of years trailing South Africa and New Zealand. Overall
the top 3 or 4 teams performed at about the same level in 2025 as in the
decade overall. There was, however, a decided slide in performance by other
teams. India had a bad year, but not as bad as Sri Lanka which at 40% dropped
was at an all-time low in terms of catching success. Note, however, that Sri
Lanka played only four Tests in the year, so the sample size was marginal. Missed Chances 2025, by Team
Zimbabwe, who actually played
nine Tests in this set, had one of their best years by this measure. Ireland
and Afghanistan don’t play a lot of Tests, but overall
their drop rates have been 27% and 29% respectively. On an individual basis, there has not been a lot of
change in the records. Nathan Lyon, now with 139 missed chances off his
bowling, has passed Jimmy Anderson (136) for second place in this century,
after Stuart Broad on 144. Judging by the way Lyon was treated in the Ashes series,
it is uncertain if he will get many more opportunities. In an interesting development, I was able to obtain a detailed list of more than
four thousand dropped chances from the CricViz database. This data goes back
to 2008, although the early years are very patchy. CricViz details 253 dropped catches for 2025, while
I found 268 (not including stumpings) in the same set of Tests. While this is
an encouraging correlation, it is also a reminder that there is a subset of missed
chances that can be a matter of opinion. Most of the excess in my data were
‘fingertip’ or half-chances. Looking at specific disagreements, I also found
cases of drops in the CricViz data that were absent from mine, being
specifically described as falling short of the fielder in Cricinfo and
Cricbuzz, which also does detailed text descriptions. I was relieved to find that CricViz reported no
drops at all in the Multan Test between Pakistan and West Indies in January 2025,
which had 19 catches. Relieved because this confirmed by own finding (after
much searching and head-scratching). The only other Tests for which I have found no
missed chances (excluding a couple of washed out or abandoned matches) are
South Africa v Zimbabwe Cape Town 2005 (17 catches) and England v New Zealand
Lord’s 2022 (22 catches). ******** Here’s another very early Test record that has stood
the test of time… Longest careers as Test Wicketkeeper
Qualification: kept wickets in their
first and last Test matches. ******** |
|||||||||||||||||||||||||||||||||||||||||||||||||||||||||||||||||||||||||||||||||||||||||||||||||||||||||||||||||||||||||||||||||||||||||||||||||||||||||||||||||||||||||||||||||||||||||||||||||||||||||||||||||||||||||||||||||||||||||||||||||||||||||||||||||||||||||||||||||||||||||||||||||||||||||||||||||||||||||||||||||||||||||||||||||||||||||||||||||||||||||||||||||||||||||||||||||||||||||||||||||||||||||||||||||||||||||||||||||||||||||||||||||||||||||||||||||||||||||||||||||||||||||||||||||||||
|
Travis Head made the highest score of the match
in four out of the five recent Ashes Tests: 123 at Perth, 170 at Adelaide, 46
at Melbourne and 163 at Sydney. The only other similar case is Don Bradman in
1930 (when he set the one-series all-time record of
974 runs). Curiously (and technically), Head only top scored
three times in the series. His 123 was in an innings where only four batsmen
batted, and normally everyone has to bat in an
innings for a player to get a top score credit. But the ‘top score of match’ stat still applies.
|
27 February 2026
A few years ago I started
gathering, from the Cricinfo bbb texts, as much data as I could on bowling
speeds in Test matches. For some reason I did not do much with this, but now
I have updated the compilation and come up with some averages.
The beauty of having such a long record is that it
offers data on all important bowlers in this century. This includes Shoaib Akhtar
of Pakistan, for whom I have readings on 135 balls spread over 18 Test
matches spanning eight years (1999-2007). This is a small sample, but I would
argue that it seems enough for a reasonable average. By contrast, I have 3772
balls Mitchell Starc.
Minimum 50 balls measured While you could say that the detail is debatable, it
seems to be a satisfying list, agreeing broadly with reputation. I know
little about Nahid Rana, who has played little outside the subcontinent, but
all reports are that he is very fast and the fastest bowler ever produced by
Bangladesh. We will see if he is able to sustain his speed.
I mentioned that a minimum of 50 measured balls was
applied. There is one interesting case that did not qualify. Shaun Tait only
has eight measured balls in the data, but his median is 149 with three balls
over 150 kph. I remember that Tait continued to regularly register over 150
in T20 matches after being discarded from Tests. I did another check on Shoaib by extracting 130
records of bowling speed from the ODI ball-by-ball records. This produced a median
of 147.1 kph and an average of 146.4. The maximum was 161.3, which has been
cited elsewhere as a record. (I deleted a ball called at 166 kph, presumably
a typo, since the text described it as a slower ball.) Tait’s median in ODIs,
based on a larger sample of 266 balls, was 146.5 kph. There is another, much more detailed, source for
bowling speeds. The Cricviz database, has been
recording most balls in recent years, more than just a sampling. However, it
has very little before 2008, and only one Test involving Shoaib Akhtar, his
last. I only have limited access to this, but I have obtained the following
comparisons.
There would appear to be some checking required in
the Cricviz data. The range for Starc, 50 to 170 kph, is quite improbable;
Lee likewise. I believe that Starc was once measured at 176 kph but that the figure
was rejected for unspecified reasons. It highlights a problem with the speed
guns: once a speed is measured it is not really possible
to go back and confirm the figure. It can be hard to distinguish between real
numbers and technical glitches. If only one ball in a thousand is a glitch,
eventually most extreme speed measurements will be glitches. ******** While on the subject of bowling speeds, Bryan French has kindly sent me an article about
the bowling speed of the fast bowlers in the Perth Test of 1975, which recorded
some extreme speeds by Jeff Thomson. It looks reasonably rigorous to me.
Contrary to some claims (that speeds were measured at the batting end or the
full length of the pitch), the speeds were measured out of the hand, just as
the speed guns do. One thing I like about this data is that the speeds could,
in principle, be checked after the fact by re-examining the films, which were
made by high-speed cameras (with calibration). This is not possible with the
speed guns.
Recorded in the Perth Test of 1975-76 Remember that these ‘fastest’ speeds were based on
very small sample sizes. Some features: ·
Only six balls by Thomson were assessed; two of them were over 99mph! ·
The numbers refer to the fastest balls recorded, not averages. ·
There a
clear gap between Thomson and the other fast bowlers. ·
Lillee and Thomson were clobbered by Fredericks and Lloyd in that
match. ·
I don’t think that Lillee was at his fastest that day even though he
broke Kallicharran’s nose. This is supported by
preliminary testing of the equipment in another match where Lillee was about
5 kph faster. ·
Holding was playing one of his first Tests. Reportedly, he would bowl
faster in coming years. ·
I remember this Test well, and Roberts (7/54) was very fast in the
second innings! ·
Speed were also measured at the batsman’s
end. The ball slowed down by 10-15 kph by the time it reached the batsman. https://www.sportstats.com.au/articles/1975bowlingspeedtest.pdf Ultimately, it should be emphasised that sheer speed
is not the be all of pace bowling, even though here are some great bowlers
among the all-time fastest. The pace bowlers with the most wickets, Anderson
and Broad, are not among the fastest 50 in my list, while Glenn McGrath would
probably not be in the fastest 100 (there is not really
enough data for him, however). Only one out of 27 balls over 155 kph
in my data took a wicket.
|
|||||||||||||||||||||||||||||||||||||||||||||||||||||||||||||||||||||||||||||||||||||||||||||||||||||||||||||||||||||||||||||||||||||||||||||||||||||||||||||||||||||||||||||||||||||||||||||||||||||||||||||||||||||||||||||||||||||||||||||||||||||||||||||||||||||||||||||||||||||||||||||||||||||||||||||||||||||||||||||||||||||||||||||||||||||||||||||||||||||||||||||||||||||||||||||||||||||||||||||||||||||||||||||||||||||||||||||||||||||||||||||||||||||||||||||||||||||||||||||||||||||||||||||||||||||
|
About 150 bowlers have taken a wicket in their first
over of Test cricket, but only Tareq Aziz of Bangladesh has managed to effect a run out. He did so at Gros Islet in 2004. Other
bowlers have seen a run out in their first over (JC Watkins, MA Hanley, SMSM
Senanayake) but they did not receive a run out credit. Aziz did not actually
take a wicket in said over, and only took one wicket in his career, for 261
runs. Four bowlers have taken a catch in their first
over bowling in Test cricket (i.e., a caught & bowled): JA Rudolph JS Patel WW Hinds
|
13 February 2026 The recent sale ($A460,000) of a Baggy Green cap
worn by Don Bradman in 1947-48 was the second sale of a cap from that season
in the past two years. Turns out that Bradman was issued with two caps and
gave both away to members of the touring Indian team of that season. Both are
now returning to Australia. It got me looking into the Baggy Green and making
some notes … Australia adopted green caps in 1899. However, the early
caps not “baggy” but were tight-fitting (skull caps) with minimal peaks. There was a coat of arms on the caps, which is still
used today. Curiously, this is not the coat of arms of Australia (as adopted
at Federation in 1901), but an earlier version. In 1921, the Australian touring team was issued caps
with a looser fit – the “Baggy Green” (although not known by that name at the
time). For some time, these included the motto “ADVANCE AUSTRALIA”, which had
been used even before the myrtle green colour was adopted in 1899. By the
early 1930s, this motto had been simplified to “AUSTRALIA” in yellow on a red
background. The term “Baggy Green” seems to date from the 1950s,
although it did not come into wide use until the 1980s. For several decades, players were issued with new
caps for every series, sometimes multiple caps (such as Bradman’s duplicate
1948 caps). The early ones were undated. After World War II, dates (seasons) were
stitched on the caps; this was discontinued by 1973. Bradman was issued with up to 13 baggy greens.
Eleven are known to still exist. The practice of issuing multiple caps
continued up to the 1980s. Len Pascoe says that he was issued with four caps
from 1977 to 1982 (14 Tests). None were dated, unlike the late Bradman caps. Even Steve Waugh was issued with multiple caps. The
one he wore to near-destruction was not his original
Test cap. The ceremonial issuing of caps to new players began
in 1996 (Kasprowicz, Elliott) under captain Mark Taylor. From this point,
only one cap was issued to each player. A near-religious veneration of the Baggy Green
developed under captain Steve Waugh, brought to a new level by a 2003 sale of
a 1948 Bradman cap for $425,000. Allowing for inflation, this remains the highest
price paid for a Baggy Green, with the exception of
Shane Warne’s cap, auctioned for over one million dollars (ironically, only
infrequently worn – Warne preferred floppy hats) in 2020. The price was
amplified by the fact that the money was going to charity (bushfire victims). ******** |
|||||||||||||||||||||||||||||||||||||||||||||||||||||||||||||||||||||||||||||||||||||||||||||||||||||||||||||||||||||||||||||||||||||||||||||||||||||||||||||||||||||||||||||||||||||||||||||||||||||||||||||||||||||||||||||||||||||||||||||||||||||||||||||||||||||||||||||||||||||||||||||||||||||||||||||||||||||||||||||||||||||||||||||||||||||||||||||||||||||||||||||||||||||||||||||||||||||||||||||||||||||||||||||||||||||||||||||||||||||||||||||||||||||||||||||||||||||||||||||||||||||||||||||||||||||
|
******** Ian Hill has alerted me to some problems with the
ball-by-ball scores of the 2000 England v West Indies series. This was in the
early days of Cricinfo’s bbb texts. These were not presented as reliable
scores, but at the time they were the only available source for the data. https://www.sportstats.com.au/zArchive/2000s/2000EW/2000EWcov.pdf ******** |
24 January 2026 Most wickets on the first 2 days of a Test (since 1920)…
Curiously, there were no Tests with more than 30
wickets on the first two scheduled days between 1912 and 1999. A number of Tests played before 1920, when wickets were poorer
and over rates high, would also feature on this list. These include three
Tests in which the full 40 wickets fell on the first two days, including the
original Ashes Test in 1882 (also Lord’s 1888 and Port Elizabeth 1895-95). ******** In response to a question, I compiled a list of
bowlers whose first over of Test cricket contained a wicket (or two). Turned
out to have exactly 150 names. The list included a few wickets that were run outs.
Most of the data (125) came from ball-by-ball records with 24 names from the Test
Cricket Lists book, from Tests that are not in the bbb record. (There are
also one or two names in TCL that have proven to be in error, and some
of the others may be regarded as unconfirmed). The 150th name was
Keith Miller, who is in neither source but it now
known to have taken a wicket with his first ball in Test cricket (in the
second innings against New Zealand in 1946, having not bowled in the first
innings). Other names from earlier times may yet come to light. Graeme Swann and Richard Johnson took two wickets in
their first over in Tests. ******** |
|||||||||||||||||||||||||||||||||||||||||||||||||||||||||||||||||||||||||||||||||||||||||||||||||||||||||||||||||||||||||||||||||||||||||||||||||||||||||||||||||||||||||||||||||||||||||||||||||||||||||||||||||||||||||||||||||||||||||||||||||||||||||||||||||||||||||||||||||||||||||||||||||||||||||||||||||||||||||||||||||||||||||||||||||||||||||||||||||||||||||||||||||||||||||||||||||||||||||||||||||||||||||||||||||||||||||||||||||||||||||||||||||||||||||||||||||||||||||||||||||||||||||||||||||||||
|
At Perth, England was over 100 runs ahead with
nine second-innings wickets in hand. Yet only two sessions later, England had
lost the Test. How rare is this?... [Conditions: team 2nd innings more than 100 runs ahead
with nine or more wickets in hand. Team is bowled out and loses match, all on
the same day...] Adelaide 2006-07, after Flintoff's (in)famous
declaration at 6/551, Australia 513, England was 69/1 on final day. Out for
129, England lost by 6 wickets. Colombo 2009, Pakistan was 285/1, 135 ahead on
the last day. Out for 320 and lost by 7 wickets.
Subramanyaiah Nallamutla Hanumantha Rao Srinivasulu Nagabhushanam Hanumantha
Rao Surampudi Nethi Hanumantha Rao Sri Nagendra Hanumantha
Rao These four names are all wrong and are completely
made up. Ultimately, Indian umpiring guru Ashru Mitra provided the full name.
It is Sakaleshpur Narayana Rao Hanumantha Rao “Rao” occurs twice; it is not a typo. Narayana
Rao is his father’s name. ******** Their first scoring shot in Test cricket was a
five… Shakeel Ahmed Pak v Zim (2), Bulawayo (Queen's)
1994/95 PR Adams Cape Town 1995-96 BW Hilfenhaus Aus v SAf
(1), Johannesburg (Wanderers) 2008/09 Naeem Islam Ban v NZ (1), Chittagong 2008/09 MD Rae NZ v WI Wellington 2025-26 ******** |
15 December 2025 Yet More Data on Fast Centuries Hundred in a Session in the Fourth Innings of a Test SJ McCabe 189* Aus v SAf
(2), Johannesburg (Old Wanderers) 1935/36 A Melville 104* SAf v Eng
(1), Nottingham (Trent Bridge) 1947 NJ Astle 222 NZ v Eng (1), Christchurch 2001/02 DR Smith 105* WI v SAf
(3), Cape Town 2003/04 Mushfiqur Rahim 101 Ban v Ind (1), Chittagong
2009/10 KS Williamson 121* NZ v SL (1), Christchurch
(Hagley) 2022/23 TM Head 123 Aus v Eng (1), Perth Stadium 2025/26 Prior to Head, Williamson was the only one to do
this for a winning side. Williamson remains the only one to score a century
after tea on the 5th day to win. Speaking of Bulawayo, there is another feature of Wiaan Mulder’s 367 not out in July that I have just
noticed. He scored a century in a session twice in the one innings. He scored
131 after tea on the first day and then 103 before lunch next day. There are
only three precedents: Mulder follows Bradman (334), Hammond (336*) and
Hayden (380). Rachin Ravindra recently scored centuries in a session in
two consecutive Tests, at Bulawayo (once again, poor Zimbabwe!) and
Christchurch. ******** Another Look at DRS LBW reviews. This time including lbw decisions that did not
attract a review. A block of 177 recent Tests was examined. In eleven
of the Tests DRS was not used, so these Tests were excluded. Only Top 6
batsmen were considered. Curiously, the number of batsmen who ended up lbw in
these Tests was actually 553. This takes into account an additional 89 batsmen who were
initially given not out lbw, but the decision was overturned by a bowling
review.
Sometimes batsmen do not review an adverse decision
because no reviews are available, or they are simply in error and might well
have been not out on review. This appears to be quite uncommon, however. ******** |
|||||||||||||||||||||||||||||||||||||||||||||||||||||||||||||||||||||||||||||||||||||||||||||||||||||||||||||||||||||||||||||||||||||||||||||||||||||||||||||||||||||||||||||||||||||||||||||||||||||||||||||||||||||||||||||||||||||||||||||||||||||||||||||||||||||||||||||||||||||||||||||||||||||||||||||||||||||||||||||||||||||||||||||||||||||||||||||||||||||||||||||||||||||||||||||||||||||||||||||||||||||||||||||||||||||||||||||||||||||||||||||||||||||||||||||||||||||||||||||||||||||||||||||||||||||
|
In 1976 against New Zealand in Karachi, Majid Khan
played one of the great opening innings, reaching 108 runs before lunch on
the first day. There is no full scoresheet for this match, but now Afzad Ahmed has published a book that includes a one-page
linear score (produced by Ben Lawrence) of Majid’s innings; as a result a full ball-by-ball record of the innings can be
built. My rendering of the innings can be found here. There are still only six cases of a century before
lunch on the first day. Majid’s remains the fastest; he reached 100 off 77
balls. A feature of the play is that only 18 eight-ball overs were bowled
before lunch. Only 138 balls were bowled before Majid reached his century.
Even though it was almost 50 years ago, the over rate is very similar to
modern rates. ********
******** I was asked about the unusual case of Indian
captain Ajit Wadekar, who scored 44 and 0 in two consecutive Tests in
1972-73. There are quite a lot of cases of players making identical scores in
two consecutive Tests if you include ducks, although very few involving a
score of 40 or more. Certainly the most notable of
all cases is Harbhajan Singh who scored 63 and 7 at Sydney in 2008, and then
the same at Adelaide. He did not play in the intervening Test in Perth. There are a few players who batted eight times in
four Tests without scoring a run, although all include 0 not outs, including
D Ramnarine and Chris Martin. ******** |
30 November 2025 More Data on Fast Centuries Travis Head’s century at Perth (100 off 69 balls)
has been described as one of the most remarkable in Ashes, coming in the
fourth team innings after none of the previous three had reached 200.
Measured from the start of the (team) innings, Head’s innings was the second-fastest
ever, behind a century by David Warner in 2011-12. A list of the fastest
centuries, measured in balls bowled after the batsman came to the crease,
follows… Fewest Balls Bowled before a Batsman
reached a Century
Well I suppose this is much the same list as the fastest
centuries in balls faced, but it does add a bit of interesting data. The data
is from various sources: no balls may or may not be included. ******** Batsmen benefiting from DRS
overturns.
Latham was given out lbw twice (to Ebadot Hossain) in one over. ******** |
|||||||||||||||||||||||||||||||||||||||||||||||||||||||||||||||||||||||||||||||||||||||||||||||||||||||||||||||||||||||||||||||||||||||||||||||||||||||||||||||||||||||||||||||||||||||||||||||||||||||||||||||||||||||||||||||||||||||||||||||||||||||||||||||||||||||||||||||||||||||||||||||||||||||||||||||||||||||||||||||||||||||||||||||||||||||||||||||||||||||||||||||||||||||||||||||||||||||||||||||||||||||||||||||||||||||||||||||||||||||||||||||||||||||||||||||||||||||||||||||||||||||||||||||||||||
|
First-class cricket at most different grounds
This table is offered with uncertainties. The
identification of grounds is sometimes difficult especially with frequent
changes of ground names. |
12 September 2025 Changing Face of Test Stats It has taken a while, but I have updated the “hotscore” file, showing
the fastest-scoring players in Test history. The update shows the impact of ‘Bazball’, with no fewer than four current England players
hurtling into the all-time Top 20. Travis Head of Australia is another bat
flying high. The Hot 100: The Fastest-Scoring Test Batsmen of All
Time Qualification: 2500 runs for
recent careers. 1,500 runs for careers ending before year 2000. Batting average greater than
20, batting position <7. Updated to September 2025.
If you relax the qualifications quite a bit to
include batsmen with just 500 runs and an average over 15, and include tailenders,
you also get an interesting list… The Fastest-Scoring Test Batsmen (500+ runs) Qualification: 500 career
runs. Batting average greater than 10. Updated September 2025.
L Amar Singh (India 1930s) scored 292
runs at 102 runs/100 balls. The extended lists are found here. At some point
I will try to update the other lists on that page, although there tends to be
little movement in the slow-scoring lists. (The previous list is here.) If you are wondering about the fastest-scoring
batsman of all, without qualification, the Australian fast bowler Jhye Richardson has faced just 14 balls in Tests and
scored 18 runs, a scoring rate of 128 runs /100 balls. His last Test
appearance was in 2021, so he could conceivably play again. ******** There have also been changes at the top in the area of head-to-head, batsman v bowler stats. After
Virat Kohli/Nathan Lyon just failed to take the top spot from Smith/Broad
last Australian season, Joe Root, facing Ravi Jadeja, swept in to pass the 600 run mark. Here is a short
article I wrote on the subject for a magazine. ******** |
|||||||||||||||||||||||||||||||||||||||||||||||||||||||||||||||||||||||||||||||||||||||||||||||||||||||||||||||||||||||||||||||||||||||||||||||||||||||||||||||||||||||||||||||||||||||||||||||||||||||||||||||||||||||||||||||||||||||||||||||||||||||||||||||||||||||||||||||||||||||||||||||||||||||||||||||||||||||||||||||||||||||||||||||||||||||||||||||||||||||||||||||||||||||||||||||||||||||||||||||||||||||||||||||||||||||||||||||||||||||||||||||||||||||||||||||||||||||||||||||||||||||||||||||||||||
|
|
29 August 2025 1902 Revisited The
1902 England-Australia Tests still rank among the finest and most memorable Ashes
series. For the statistician, however, it is a frustrating series in that it
is poorly represented by original scorebooks. At the Australian end, no tour
book is known, and in England only one full Test score (Edgbaston) survives,
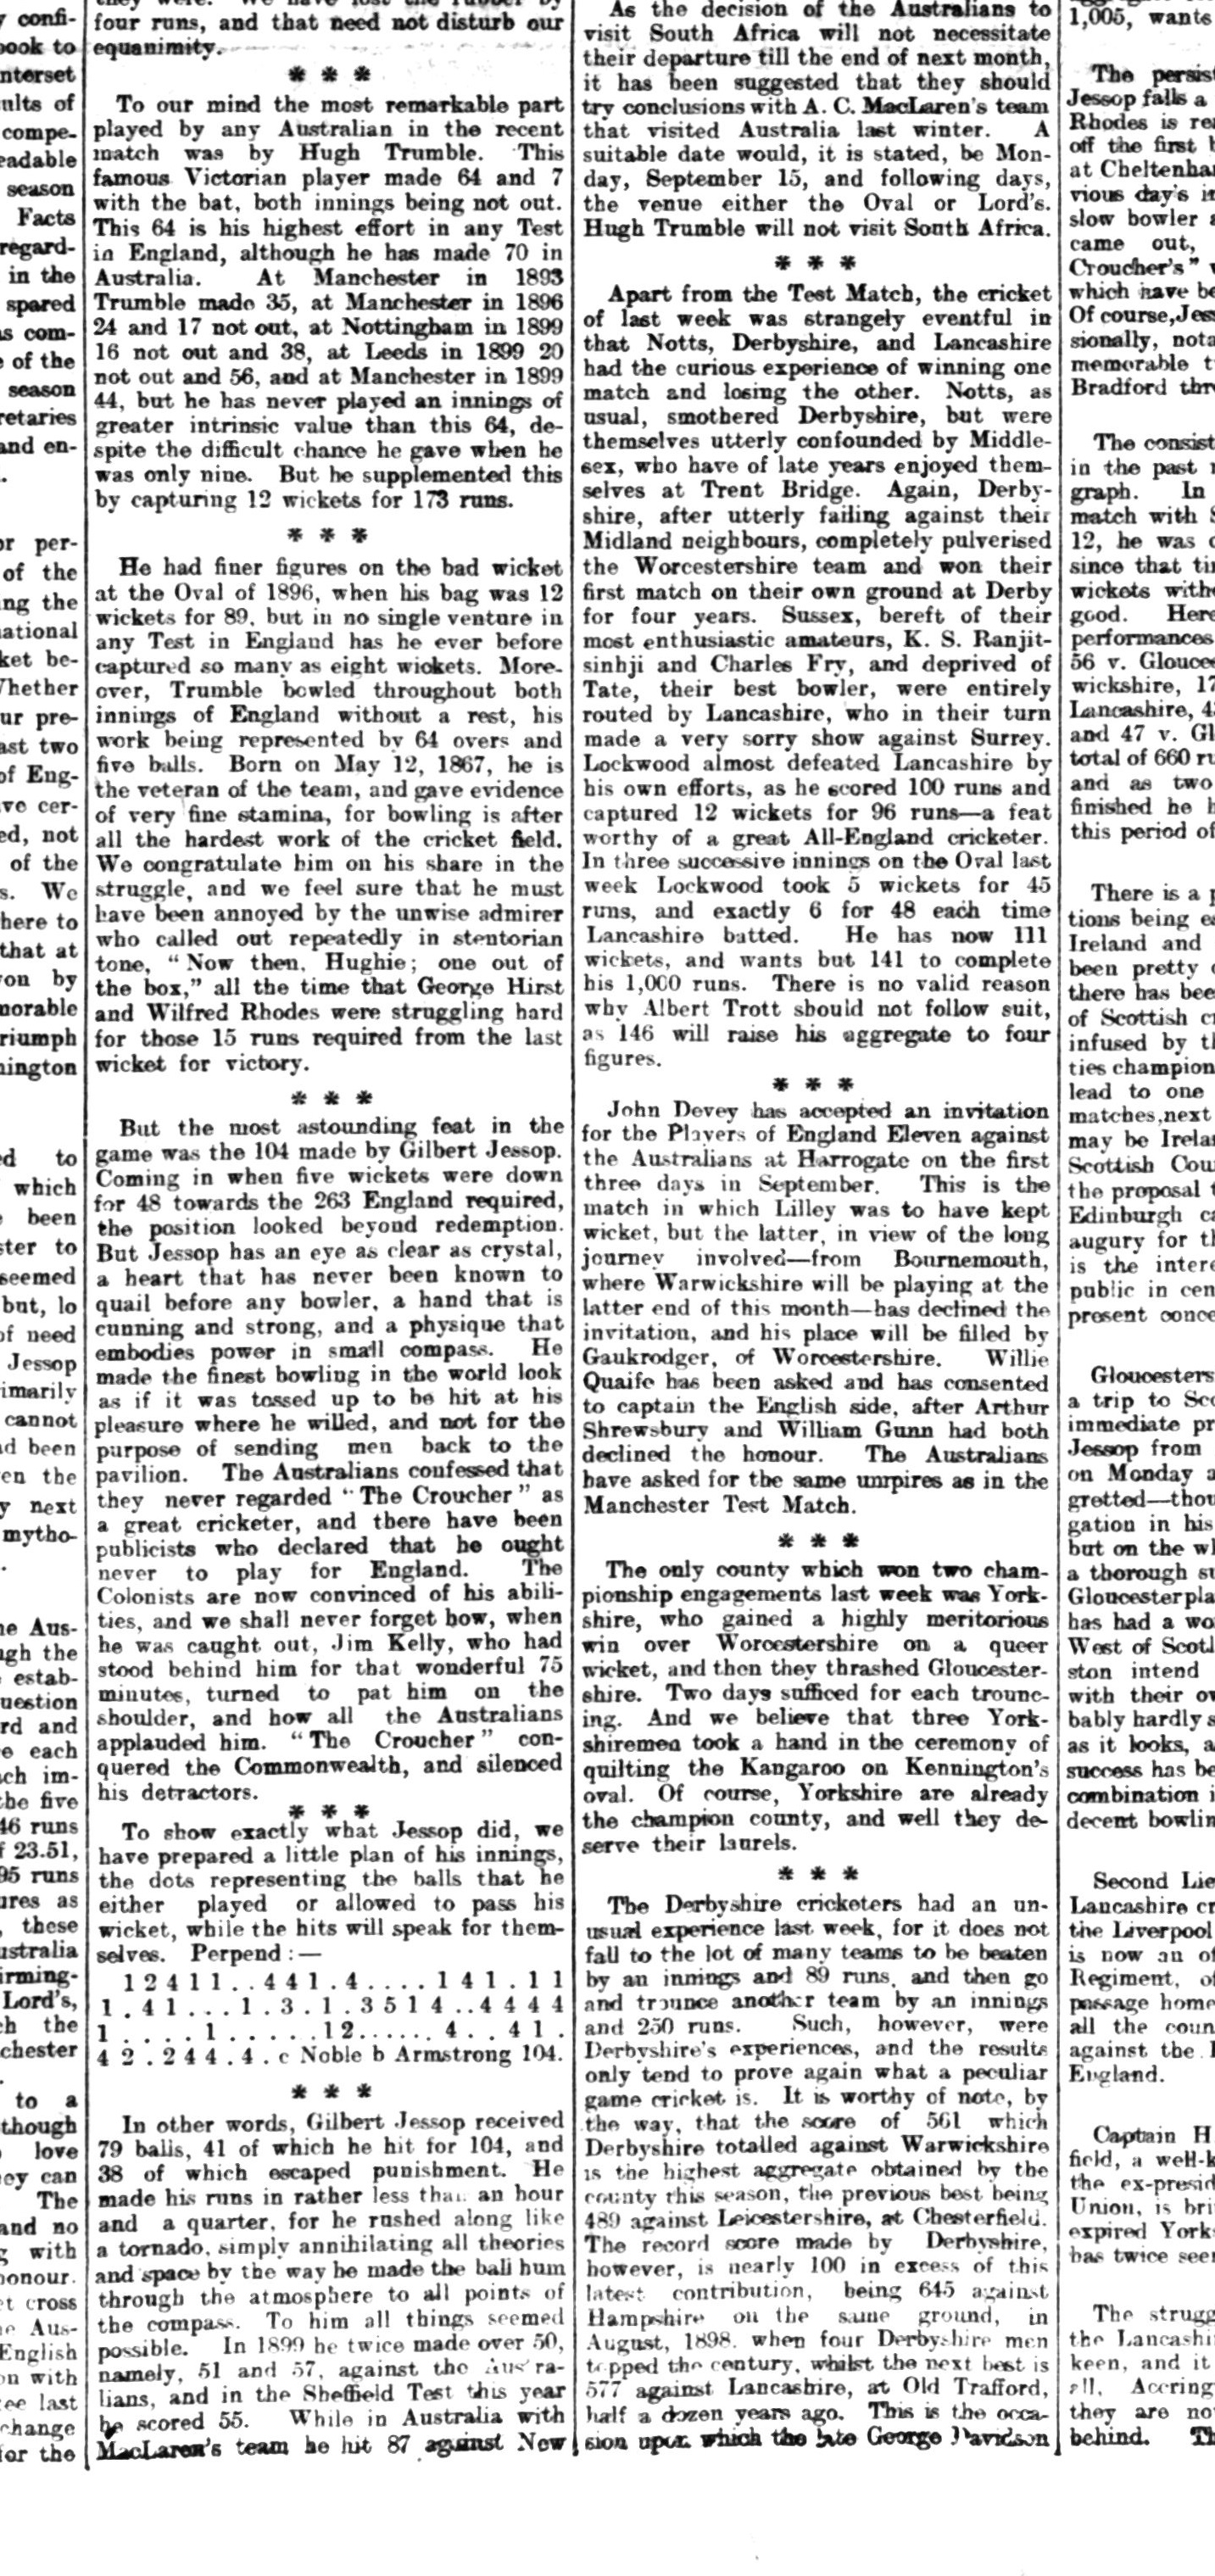
along with a partial score (lacking bowling details) for the Manchester Test. Now
there has been some progress, and on a couple of fronts. Simon Wilde has
published a fascinating book “Chasing Jessop” about 1902 and focussing
on Gilbert Jessop’s famed 104 at The Oval, where England won by one wicket.
Using the ever-expanding British Newspaper Archive, Wilde has uncovered some
new sources, a couple of which give ball-by-ball accounts for Jessop’s
hundred. Wilde found the source of Gerald Brodribb’s account, a source that
had eluded me for a long time. It was not in a daily newspaper, but in The
Athletic News and Cyclists’ Journal, a weekly published five days after
the event.
Test
1 Edgbaston: reconstructed ball-by-ball from a full scorebook. Test
4 Old Trafford Aus 1st innings
reconstructed by me some years ago from newspaper reports and the partial
scorebook. Could do with more work. Test
5 The Oval: full reconstruction of England 2nd innings by S Wilde. The
cover page for the series, with the updated files, is
here. ******** |
|||||||||||||||||||||||||||||||||||||||||||||||||||||||||||||||||||||||||||||||||||||||||||||||||||||||||||||||||||||||||||||||||||||||||||||||||||||||||||||||||||||||||||||||||||||||||||||||||||||||||||||||||||||||||||||||||||||||||||||||||||||||||||||||||||||||||||||||||||||||||||||||||||||||||||||||||||||||||||||||||||||||||||||||||||||||||||||||||||||||||||||||||||||||||||||||||||||||||||||||||||||||||||||||||||||||||||||||||||||||||||||||||||||||||||||||||||||||||||||||||||||||||||||||||||||
|
A report in the Adelaide Chronicle for the 5th
day of the Adelaide Test in 1907-08 (15th January) claimed that the
temperature reached 111 degrees Fahrenheit (44 Celsius). I wondered about the
accuracy of this, but the Adelaide Register and the Advertiser both gave an
official maximum for the city that day of 111.4 degrees “in the shade and 153
degrees in the sun”. The temperature at Eucla in W.A. was recorded as 122 in
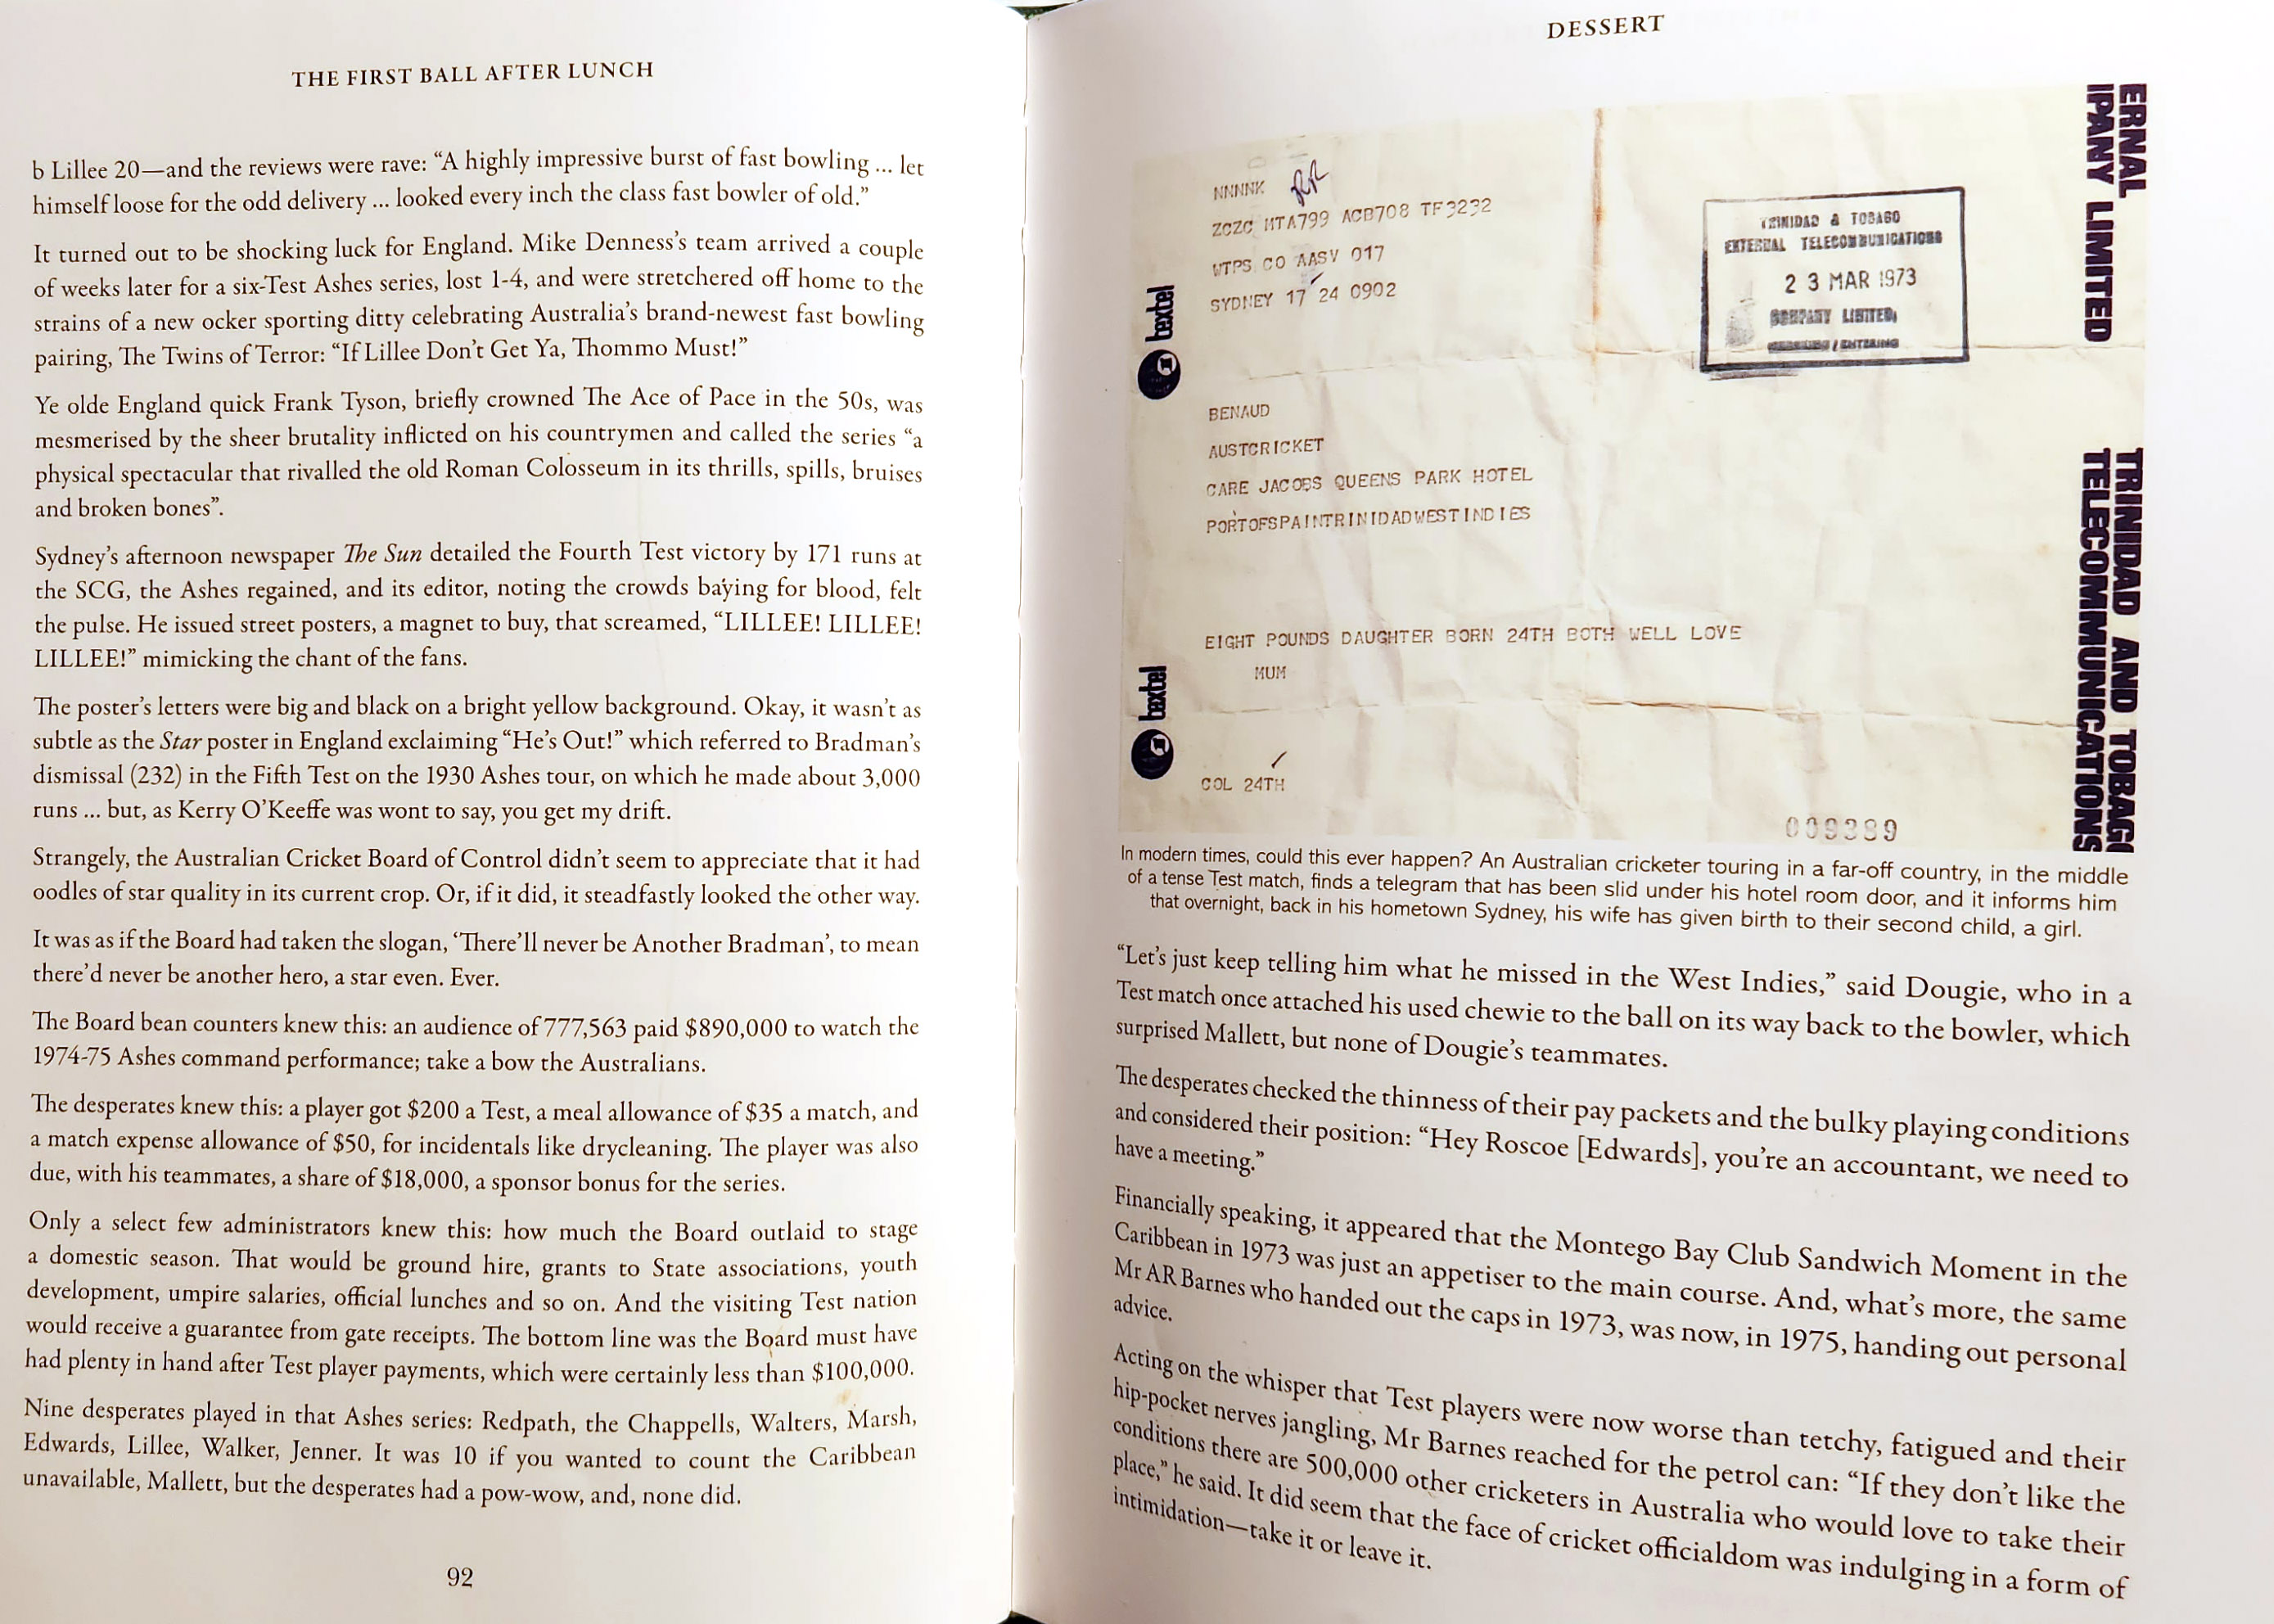
the shade (50 Celsius) and “179 in the sun” (!). John Benaud has a book out about the 1973
Australian tour of West Indies: “The First
Ball after Lunch”. There are
a couple of little snippets that show up how cricket, and society, have
changed. Benaud mentions player payments from the time: A$200 per Test plus a
few allowances. Sponsorship was starting to add to this, but not by a lot.
I seem to recall that one of Allan Border’s
children was born while he was batting in a Test. It was one of the only days
of his career where he was dismissed twice. ******** |
Bob Simpson 1936-2025 I saw Bob Simpson play from time to time in the late
60s/early70s. He played in Sydney for Western Suburbs 1st Grade, whose home
ground was near our home. Having retired too early from first-class cricket, he
was still one of the best bats in the world, and he rather terrorised the
Club bowlers. He was one of a cohort of Australians at the time who gave up
the game because of poor pay and the need to make a career elsewhere. My father was a 1st grade umpire and knew Bob. One
day when Wests were playing away and Dad was umpiring
I spent the day watching (getting out of Mum's hair). Bob gave us a lift
home. Dad introduced me. I was too shy to say anything much, but I was most
impressed that Dad and Bob were on a first name basis and chatted all the way
home. My school friend Malcolm Gorham was a cricket (and
Simpson) fanatic. While still at school, he had managed to get a gig as
Western Suburbs scorer, using linear scoring. Malcolm went on to score Test
matches at the SCG, but died (far too young) decades
ago. Simpson famously returned to Tests in 1977 after a
10-year break and scored a couple more centuries. Simpson’s passing on August 15 brings to five the number
of players from the 1966-67 tour of South Africa who have died in the last
few months. I can't find any other cases of five members of a team passing
away so close to one another. The nearest I found was five deaths in 639 days
for the South African team that played in Durban in Durban in 1935-36.
|
|||||||||||||||||||||||||||||||||||||||||||||||||||||||||||||||||||||||||||||||||||||||||||||||||||||||||||||||||||||||||||||||||||||||||||||||||||||||||||||||||||||||||||||||||||||||||||||||||||||||||||||||||||||||||||||||||||||||||||||||||||||||||||||||||||||||||||||||||||||||||||||||||||||||||||||||||||||||||||||||||||||||||||||||||||||||||||||||||||||||||||||||||||||||||||||||||||||||||||||||||||||||||||||||||||||||||||||||||||||||||||||||||||||||||||||||||||||||||||||||||||||||||||||||||||||
|
The shortening of boundaries, which have been in place
for more than 20 years now, has led to shots for three becoming far less
common. The most in this decade is 45 at Brisbane in 2020-21. There were 85 threes in the Ashes Test at
Adelaide Oval in 1994-95. Of the historical Top 20 where data is available,
ten were at the MCG. At Headingly in 2023, there were no threes at
all. ******** A minor record: Wiaan
Mulder’s 367* at Bulawayo is the highest score by a batsman who was dismissed
by a no ball: previously Warner 335*. Mulder was 'bowled' by LT Chivanga on
247. I believe that Len Hutton was caught in the deep
off a no ball when he made 364, although in those days with the early call it
was effectively a free hit. Most runs added after being dismissed by a no
ball: 279 by Sangakkara (287). Dale Steyn 'bowled' Sangakkara and had him
dropped in the same over. The pair then added more than 600 runs. |
14 August 2025 I thought I'd share an observation about the recent
resurgence in batsmen retiring hurt. The incidence of retirements has jumped
in the last few years. I wouldn’t read too much into each fluctuation in the
figures, but there are definitely some trends.
******** UPDATE of a list from only a couple of weeks ago. At
The Oval, for the second time in the series, the losing side scored more runs
off the bat than the winning side. At Lord’s England had beaten India by 22
runs, at The Oval it was India winning by 5 runs. There had only been four
previous such Tests in all Test history. Winning a Test with fewer runs off the bat
Tests won by runs margin with no
follow-on. In the 1992 match, Sri Lanka managed to bowl 53 no
balls to Australia’s 19, and lost by 16 runs. At the
Oval, England bowled 22 wides to India’s 11 and lost by 5 runs. |
|||||||||||||||||||||||||||||||||||||||||||||||||||||||||||||||||||||||||||||||||||||||||||||||||||||||||||||||||||||||||||||||||||||||||||||||||||||||||||||||||||||||||||||||||||||||||||||||||||||||||||||||||||||||||||||||||||||||||||||||||||||||||||||||||||||||||||||||||||||||||||||||||||||||||||||||||||||||||||||||||||||||||||||||||||||||||||||||||||||||||||||||||||||||||||||||||||||||||||||||||||||||||||||||||||||||||||||||||||||||||||||||||||||||||||||||||||||||||||||||||||||||||||||||||||||
|
|
Forty years ago (1985) I was travelling around
southern Africa, part of a 5-month round the world trip which also took me to
North America and Europe. It was mostly low budget solo travel - I never
spent more than $20 on a night's accommodation, even in Switzerland - but I
did join small group tours to remoter places like Namibia and Botswana. Since I wasn't completely broke when I got home to
Sydney, I drove up to Cairns and beyond for a bit. Don't ask me why. After
that I WAS completely broke. I have written down a few little memories of that
trip and my other travels last Century. https://www.sportstats.com.au/Travel/Travelslist.pdf ******** Making a Century after being dropped
first ball…
Since 2002 only. The Hussey case is debatable and may
not have been a dropped catch. |
|||||||||||||||||||||||||||||||||||||||||||||||||||||||||||||||||||||||||||||||||||||||||||||||||||||||||||||||||||||||||||||||||||||||||||||||||||||||||||||||||||||||||||||||||||||||||||||||||||||||||||||||||||||||||||||||||||||||||||||||||||||||||||||||||||||||||||||||||||||||||||||||||||||||||||||||||||||||||||||||||||||||||||||||||||||||||||||||||||||||||||||||||||||||||||||||||||||||||||||||||||||||||||||||||||||||||||||||||||||||||||||||||||||||||||||||||||||||||||||||||||||||||||||||||||||
|
Much has been said about records set in the
Kingston Test, with West Indies bowled out for 27. Some adds… The innings saw the slowest over rate in Test history
for a complete innings – around 55 balls per hour (pending a check of times).
One could argue mitigating circumstances. ******** In 1974 Gerald Brodribb published a biography of
Gilbert Jessop (The Croucher) that included a ball-by-ball summary of
Jessop’s famous 104 in the Oval Test of 1902. Brodribb did not name his
source, and over many years I have not been able to locate it. Such
frustration. ********* I try to record fielder locations for all catches
in Tests. In the Lord’s Test, Washington c Brook v Archer was the first catch
by a longstop that I have noted since Tom Horan took a couple in 1879 ! I have often thought that longstop would be a
useful position in T20 with all those ramp shots, but I haven't seen it in
Tests. I don't know if anyone recalls anything similar. ******** Most runs on first day as a Test captain…
******** At Hyderabad in 1983, Javed Miandad faced a
hat-trick ball from BS Sandhu and went on to score 280 not out in a
partnership of 451 with Mudassar. Gavaskar probably faced a hat-trick ball to start
his 236 at Chennai but I don't have enough detail to be sure. None of the
reports I have specifically says so. I only have ball-by-ball data for about 80-85% of
hat-trick balls. If wickets are taken with the last two balls of an over,
then either bat could face the hat-trick ball. ******** |
20 July 2025 I have written before (as long ago as 2006!) about
the intriguing limited-overs match in South Africa in 1967 between the
touring Australians and a “Sports Roundup Invitation XI”, effectively a fully-representative South Africa. Although not
‘official’, it has enough hallmarks of a One-Day International to be
recognised as the first such match (IMHO).
South African XI v Australians, 50-over match,
Johannesburg 4-Mar-1967
Australia
Innings FoW
TR Veivers retired hurt at 5 for 276. South
Africa Innings FoW
The match was 50 (6-ball) overs a side, with bowlers
limited to 11 overs. Although arguably played in a ‘picnic’ atmosphere, there
was money at stake; it was taken seriously enough for the keeper Brian Taber
to be dropped and Simpson taking the gloves to strengthen the Australians
batting. Grahame Thomas of NSW was in the team and scored 70; he had not
played in the Tests, but his mere presence in apartheid South Africa is
interesting in that he was part-aboriginal – especially in
light of the D’Oliveira affair less than two
years later. For the South Africans, the first appearance of Barry Richards
is notable. Keith Stackpole hit a ball from fast man Peter Pollock
clean out of the ground, but was out next ball. Tom
Veivers then came in and appears to have retired hurt first ball; he did not
bowl later. The over eventually cost 10 runs even with two wickets
(Stackpole, Thomas) plus Veivers’ retirement (1 leg
bye, 6, W, RH, 3, W). The match was scored by two women, “Miss P Williams
and Miss SR Hall”. Tour scorer M (Mitch?) McClennan is also named, but the
score is not in his handwriting. (I believe that McClennan was a South
African scorer contracted to score on the tour; he also did 1957-58). An
image of a page from the score is here. I have posted
before an article on
the match by Alf Batchelor. ******** At Lord’s England beat India by 22 runs in spite of hitting fewer runs off the bat. There have
only been five such Tests… Winning a Test with fewer runs off the bat
Tests won by runs margin with no
follow-on. In the 1992 match, Sri Lanka managed to bowl 53 no
balls to Australia’s 19, and lost by 16 runs. ******** |
|||||||||||||||||||||||||||||||||||||||||||||||||||||||||||||||||||||||||||||||||||||||||||||||||||||||||||||||||||||||||||||||||||||||||||||||||||||||||||||||||||||||||||||||||||||||||||||||||||||||||||||||||||||||||||||||||||||||||||||||||||||||||||||||||||||||||||||||||||||||||||||||||||||||||||||||||||||||||||||||||||||||||||||||||||||||||||||||||||||||||||||||||||||||||||||||||||||||||||||||||||||||||||||||||||||||||||||||||||||||||||||||||||||||||||||||||||||||||||||||||||||||||||||||||||||
|
250 and 150 in a first-class match. Dhruv Shorey, 252* and 150* Delhi v Assam 2022-23 Shubman Gill 269 and 161, Edgbaston 2025 Warwick Armstrong came very close in 1920: 157*
and 245 in a Sheffield Shield match ******** At Hyderabad in 1983, Javed Miandad faced a
hat-trick ball from BS Sandhu and went on to score 280 not out in a
partnership of 451 with Mudassar. Gavaskar probably faced a hat-trick ball to start
his 236 but I don't have enough detail to be sure. None of the reports I have
specifically says so. I only have ball-by-ball data for about 80-85% of
hat-trick balls. If wickets are taken with the last two balls of an over, then
either bat could face the hat-trick ball. ****** |
11 July 2025 Here is a broad look at a ‘batting decay curve’, the
number of innings by recognised batsmen (those with median batting positions
1 to 6) at every level of scoring. I have taken the liberty of including not
outs by adding the batsman’s career average to the score (this can be
supported statistically, in a broad sense). So an
innings of 100 not out by a batsman who averages 50 registers as a score
equivalent to 150. Above a score of 50, I have pooled results to smooth
the curve. So the point at 110 represents the
average of scores 106 to 115. The size of the pool is larger at very high
(and rarer) scores. Averaging out at the high end, across a wide pool, can
give values less than 1.
The graph is log-linear because the results are exponential,
with quite a good fit to a simple exponential decay curve (the trendline is
based on data from 15 to 300). Put simply, a batsman’s chances of getting out
when he reaches a given score is about 2.6 per cent, and this applies, in a
broad sense, at all scores from about 20 all the way to 300 or beyond.
Naturally, individual batsmen can and do deviate from this trend, but the
averages are fairly consistent. There are some general deviations, though. That 2.6 per
cent probability of getting out doesn’t settle down until a score of about
15. In particular, There are more than 4200 ducks
which represent about 15 per cent of all innings. Between 50 and 100, the
chances of getting out are slightly lower than the long-view average, while
from 200 to 250, the chances are a bit higher. ******** 400 runs in a first-class match without
a quadruple century
[Note: EDITED the Perera instance was left out of the
original table.] |
|||||||||||||||||||||||||||||||||||||||||||||||||||||||||||||||||||||||||||||||||||||||||||||||||||||||||||||||||||||||||||||||||||||||||||||||||||||||||||||||||||||||||||||||||||||||||||||||||||||||||||||||||||||||||||||||||||||||||||||||||||||||||||||||||||||||||||||||||||||||||||||||||||||||||||||||||||||||||||||||||||||||||||||||||||||||||||||||||||||||||||||||||||||||||||||||||||||||||||||||||||||||||||||||||||||||||||||||||||||||||||||||||||||||||||||||||||||||||||||||||||||||||||||||||||||
|
|
“Substitute” bowlers taking a
wicket in same over
|
|||||||||||||||||||||||||||||||||||||||||||||||||||||||||||||||||||||||||||||||||||||||||||||||||||||||||||||||||||||||||||||||||||||||||||||||||||||||||||||||||||||||||||||||||||||||||||||||||||||||||||||||||||||||||||||||||||||||||||||||||||||||||||||||||||||||||||||||||||||||||||||||||||||||||||||||||||||||||||||||||||||||||||||||||||||||||||||||||||||||||||||||||||||||||||||||||||||||||||||||||||||||||||||||||||||||||||||||||||||||||||||||||||||||||||||||||||||||||||||||||||||||||||||||||||||
|
|
|
|||||||||||||||||||||||||||||||||||||||||||||||||||||||||||||||||||||||||||||||||||||||||||||||||||||||||||||||||||||||||||||||||||||||||||||||||||||||||||||||||||||||||||||||||||||||||||||||||||||||||||||||||||||||||||||||||||||||||||||||||||||||||||||||||||||||||||||||||||||||||||||||||||||||||||||||||||||||||||||||||||||||||||||||||||||||||||||||||||||||||||||||||||||||||||||||||||||||||||||||||||||||||||||||||||||||||||||||||||||||||||||||||||||||||||||||||||||||||||||||||||||||||||||||||||||
